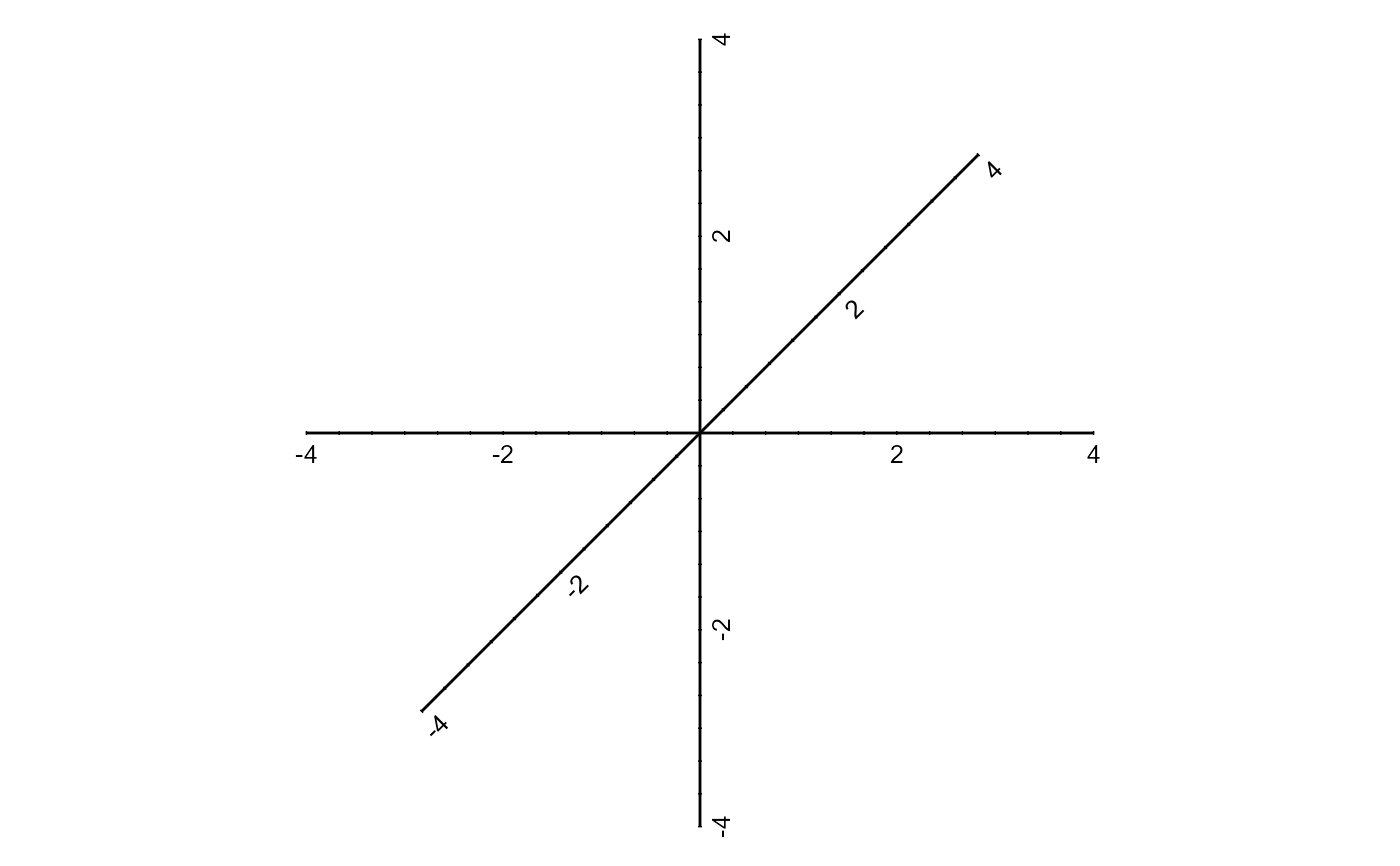
Draw skewed axes in ggplot2
Arguments
- theta
angle in radians
- axis_title
character
- draw_ticks
logical
- draw_axis_text
logical
- remove_origin
logical
- tick_height
height of ticks
- lwd
line width
- text_size
size of text
- color
color of lines
- family
font family
- mu
mean of variable
- sigma
standard deviation of variable
- tick_label_interval
interval of ticks
Examples
library(ggplot2)
ggplot(data.frame(x = c(0,1), y = c(4,4))) +
  skewed_axis(pi / 2, color = "black") +
  skewed_axis(pi / 4, color = "black") +
  skewed_axis(0, color = "black") +
  theme_void() +
  coord_equal()
