
pnorm(1.5713)[1] 0.9419435In psychological assessment, sometimes we want to contrast two scores. For example, suppose we give two tests of visual-spatial ability to an individual. On Test A the score was 95, and on Test B the score was 75.
Both tests are measured with the standard score metric (mean = 100, SD = 15). Because these tests are intended to measure the same ability, we are surprised to see that they differ by 20 points (20 standard score points = 1⅓ standard deviations). How common is it for tests that allegedly measure the same thing to differ by 20 points or more?
The answer, of course, depends on the distributions of both variables and the form of the relationship between the two variables. In this case, let’s assume that the tests are multivariate normal, meaning that both variables have normal distributions and any linear combination of the two scores (including subtracting the scores) is also normal.
The relationship between the two variables is linear. Linear relationships are fully described by correlation coefficients. In this case, suppose that the correlation coefficient is 0.64.
Few variables found in nature have a true multivariate normal distribution. However, multivariate normal distributions describe cognitive ability data reasonably well.
The mean of the sum of two variables is the sum of the two means. That is,
\mu_{A + B} = \mu_A + \mu_B=100+100=200
It works the same way with subtraction:
\mu_{A - B} = \mu_A - \mu_B=100-100=0
The standard deviation of the sum of two variables is the square root of the sum of the two variables’ covariance matrix. The covariance matrix is:
\Sigma_{AB}=\begin{bmatrix} \sigma_A^2 & \sigma_{AB} \\ \sigma_{AB} & \sigma_B^2 \end{bmatrix}
The sum of the covariance matrix is:
\sigma_{A+B}=\sqrt{ \sigma_{A}^2 + 2\sigma_{AB} + \sigma_{B}^2}
The covariance is the product of the two standard deviations and the correlation (\rho):
\sigma_{AB}=\sigma_A \sigma_B \rho_{AB}
Thus,
\begin{aligned} \sigma_{A+B}&=\sqrt{ \sigma_{A}^2 + 2\sigma_{AB} + \sigma_{B}^2}\\ &=\sqrt{ \sigma_{A}^2 + 2\sigma_A \sigma_B \rho_{AB} + \sigma_{B}^2}\\ &=\sqrt{15^2+2*15*15*0.64+15^2}\\ &\approx 27.1662 \end{aligned}
The standard deviation of the difference of two variables is the same except that the covariance is negative.
\begin{aligned} \sigma_{A-B}&=\sqrt{ \sigma_{A}^2 - 2\sigma_{AB} + \sigma_{B}^2}\\ &=\sqrt{ \sigma_{A}^2 - 2\sigma_A \sigma_B \rho_{AB} + \sigma_{B}^2}\\ &=\sqrt{15^2-2*15*15*0.64+15^2}\\ &\approx12.7279 \end{aligned}
If \sigma_A=\sigma_B then this formula reduces to
\begin{aligned} \sigma_{A-B}&=\sigma_A\sqrt{2-2r_{AB}}\\ &=15\sqrt{2-2\times.64}\\ &\approx12.7279 \end{aligned}
If the two variables are multivariate normal, then the difference score is also normally distributed. The difference of A and B in this example is:
\begin{aligned}A-B&=95-75\\&=20\end{aligned}
The population mean of the difference scores is 0 and the standard deviation is 13.24.
Using the z-score formula,
\begin{aligned} z&=\dfrac{X-\mu}{\sigma}\\ &=\dfrac{20-0}{12.7279}\\ &\approx 1.5713 \end{aligned}
The cumulative distribution function of the standard normal distribution (Φ) is the proportion of scores to the left of a particular z-score.
In R the Φ function is the pnorm function.
pnorm(1.5713)[1] 0.9419435from scipy.stats import norm
norm.cdf(1.5713)0.9419435093908327In Excel, the Φ function is the NORM.S.DIST function.
\begin{aligned} \Phi(1.5713)&=\texttt{NORM.S.DIST}(1.5713)\\&\approx 0.9419 \end{aligned}
Thus about 5.8% (1 − .9419 = .0581) of people have a difference score of 20 or more in this particular direction and about 11.6% have a difference score of 20 or more in either direction. Thus, in this case, a difference of 20 points or more is only somewhat unusual.
The standard deviation is a sort of average deviation but it is not the arithmetic mean of the deviations. If you really want to know the average (unsigned) deviation, then you want the absolute deviation. Technically, the absolute deviation is the expected value of the absolute value of the deviation:
\text{Absolute Deviation}=E(|X-\mu|)
Sometimes the absolute deviation is calculated as the average deviation from the median instead of from the mean. In the case of the normal distribution, this difference does not matter because the mean and median are the same.
In the normal distribution, the absolute deviation is about 80% as large as the standard deviation. Specifically,
\text{Absolute Deviation}=\sqrt{\dfrac{2}{\pi}}\sigma
If the two variables are multivariate normal, the difference score is also normal. We calculate the standard deviation of the difference score and multiply it by the square root of 2 over pi. In this case, the standard deviation of the difference score was about 13.42. Thus, the average difference score is:
\sqrt{\dfrac{2}{\pi}}12.7279\approx 10.1554
The standard deviation is the standard way of describing variability. Why would we use this obscure type of deviation then? Well, most people have not heard of either kind of deviation. For people who have never taken a statistics course, it is very easy to talk about the average difference score (i.e., the absolute deviation). For example, “On average, these two scores differ by 11 points.” See how easy that was?
By contrast, imagine saying to statistically untrained people, “We can measure variability with a statistic called the standard deviation. To calculate it, we take the square root of the average squared difference of every score in the population from the population mean. In this case, the standard deviation is 13 points.” Sure, this explanation can be made simpler…but at the expense of accuracy.
The absolute deviation can be explained easily AND accurately.
Related to the idea of the absolute deviation is the half-normal distribution. The half-normal distribution occurs when we take a normally distributed variable and take the absolute value of all the deviations.
Y=|X-\mu_X|
To visualize the half-normal distribution, we divide the normal distribution in half at the mean and then stack the left side of the distribution on top of the right side (see Figure 2).
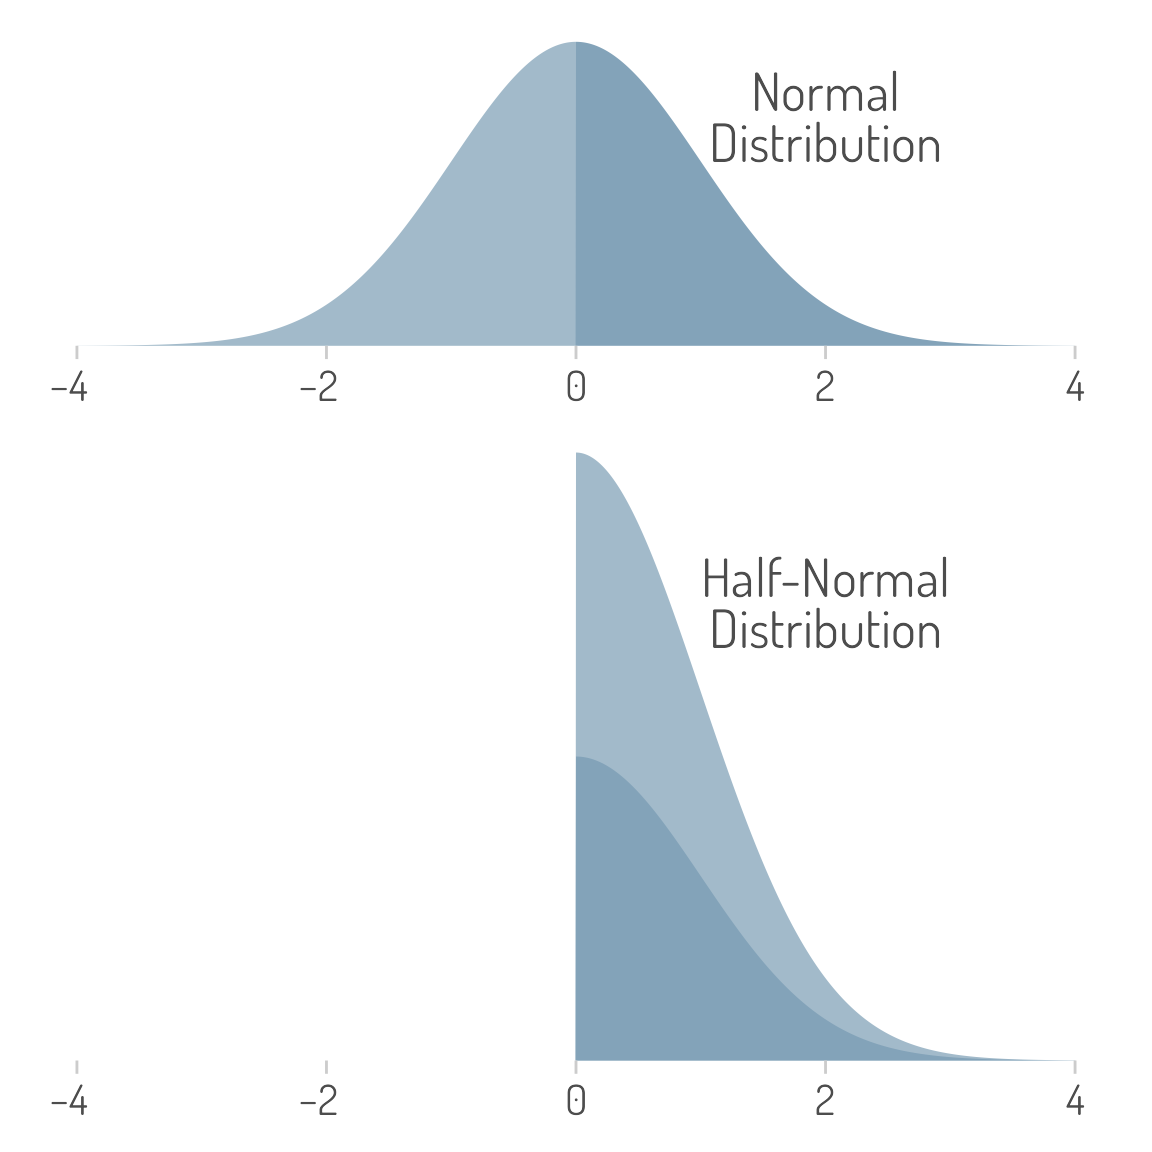
What is the mean of the half-normal distribution? Yes, you guessed it—the absolute deviation of the normal distribution!
The cumulative distribution function of the half-normal distribution is:
cdf_{\text{half-normal}}=2\Phi\left(\frac{X}{\sigma}\right)-1
A <- 95
B <- 75
sigma <- 15
r <- .64

AB_difference <- A - B
sigma_difference <- sigma * sqrt(2 - 2 * r)

2 * pnorm(AB_difference/sigma_difference) - 1
[1] 0.8838983from scipy.stats import norm
A = 95
B = 75
sigma = 15
r = .64
AB_difference = A - B
sigma_difference = sigma * (2 - 2 * r) ** .5
2 * norm.cdf(AB_difference/sigma_difference) - 10.8838982560194513In Excel, the Φ function is the NORM.S.DIST function.
=2*NORM.S.DIST((95-75)/(15*SQRT(2-2*.64)))-1
This means that about 88.4% of people have a difference score (in either direction) of 20 or less. About 11.6% have a difference score of 20 or more. Note that this is the same answer we found before using the standard deviation of the difference score.
This post was originally posted on 2014-05-05 here. The figures and computations have been updated.
@misc{schneider2014,
  author = {Schneider, W. Joel},
  title = {Difference Scores, the Absolute Deviation, and the
    Half-Normal Distribution},
  date = {2014-05-05},
  url = {https://wjschne.github.io/AssessingPsyche/2014-05-05-difference-scores-absolute-deviation-half-normal-distribution/},
  langid = {en}
}