Variables
In science and mathematics, there are fundamental constants—things that always remain the same (e.g., c the speed of light in a vacuum, or \pi, the ratio of a circle’s circumference to its diameter). However, most phenomena we study are capable of change. Indeed, much of scientific investigation consists of discovering how change in one process affects changes in other processes. Any process or quantity that can change is called a variable.
A constant is a state or quantity that remains the same.
A variable is an abstract category of information that can assume different values.
Algebraic Variables
An algebraic variable usually takes on any value, but it can be constrained by equations and other kinds of relationships. Consider this equation:
2x-6=0 \tag{1}
In isolation, the variable x could be any real number. However, once inserted in an equation, x is constrained in some way. In Equation 1, x must equal 3.
Random Variables
Random variables are not like algebraic variables. The values that random variables can take on are determined by one or more random processes. For example, the outcome of a coin toss is a random variable. It can either be heads or tails. Think of a random variable as forever spitting out new values. In Figure 1, the random variable is an endless cascade of coins.
In this case, the set of possible values {heads,tails} is the sample space of the outcome of a coin toss. A random variable's sample space is the set of all possible values that the variable can assume. In the case of the roll of a six-sided die, the sample space is {1,2,3,4,5,6}. This sample space has a finite number of values. However, some sample spaces are infinite. For example, the number of siblings one can have is the set of all non-negative integers {0,1,2,3,...}. Of course, because there are limits as to how many children people can have, the probability of very high numbers is very low. A different kind of infinity is observed in the sample space of variables that are continuous. The length of one's foot in centimeters can be any positive real number. Between any two real numbers, (e.g., 20cm and 30cm) there is an infinite number of possibilities because real numbers can be sliced as thinly as needed (e.g., 28.465570098756642111cm).
Measurement Scales
The classic taxonomy for discussing different types of measurement scales was proposed by Stevens (1946). Other taxonomies exist but Stevens’ system is familiar to everyone who has been trained in the social sciences. In Stevens’ system in Figure 2, there are four types of scales, Nominal, Ordinal, Interval, and Ratio, which can remembered using the acronym NOIR (French for black).
A taxonomy is a system of classifying things. For example, the Periodic Table of Elements is a taxonomy of the elements.

Nominal Variables
Nominal variables can take on any kind of value, including values that are not numbers. The values must constitute a set of mutually exclusive categories. For example, if I have a set of data about college students, I might record which major each person has. The variable college major consists of different labels (e.g., Accounting, Mathematics, and Psychology). Note that there is no true order to college majors, though we usually alphabetize them for convenience. There is no meaningful sense in which English majors are higher or lower than Biology majors. Nominal values are either the same or they are different. They are not less than or more than anything else.
In a set of mutually exclusive categories, nothing belongs to more than one of the categories in the set at the same time.
Examples of Nominal Variables
- Biological sex {male, female}
- Race/Ethnicity {African-American, Asian-American,...}
- Type of school {public, private}
- Treatment group {Untreated, Treated}
- Down Syndrome {present, not present}
- Attachment Style {dismissive-avoidant, anxious-preoccupied, secure}
- Which emotion are you feeling right now? {Happiness, Sadness, Anger, Fear}
Ordinal Variables
Like nominal variables, ordinal variables are categorical. Whereas the categories in nominal variables have no meaningful order, the categories in ordinal variables have a natural order. For example, questionnaires often ask multiple-choice questions like so:
I like chatting with people I do not know.
- Strongly disagree
- Disagree
- Neutral
- Agree
- Strongly agree
It is clear that the response choices have an order that would generate no controversy. Note, however, that there is no meaningful distance between the categories. Is the distance between strongly disagree and disagree the same as the distance between disagree and neutral? It is not a meaningful question because no distance as been defined. All we can do is say is which category is higher than the other.
Examples of Ordinal Variables
- Dosage {placebo, low dose, high dose}
- Order of finishing a race {1st place, 2nd place, 3rd place,…}
- ISAT category {below standards, meets standards, exceeds standards}
- Apgar score {0,1,…,10}
Interval Scales
Interval scales are quantitative. The values that interval scales take on are almost always numbers. Furthermore, the distance between the numbers have a consistent meaning. The classic example of an interval scale is temperature on the Celsius or Fahrenheit scale. The distance between 25° and 35° is 10°. The distance between 90° and 100° is also 10°. In both cases, the difference involves the same amount of heat.
Unlike with nominal and ordinal scales, we can add and subtract scores on an interval scale because there are meaningful distances between the numbers.
Interestingly, the meaning of 0°C (or 0°F) is not what we are used to thinking about when we encounter the number zero. Usually, the number zero means the absence of something. Unfortunately, the number zero does not have this meaning in interval scales. When something has a temperature of 0°C, it does not mean that there is no heat. It just happens to be the temperature at which water freezes at sea level. It can get much, much colder. Thus, interval scales lack a true zero in which zero indicates a complete absence of something.
A true zero indicates the absence of the quantity being measured.
Lacking a true zero, interval scales cannot be used to create meaningful ratios. For example, 20°C is not “twice as hot” as 10°C. Also, 110°F is not “10% hotter” than 100°F.
Nearly Interval Scales
In truth, there are very, very few examples of variables with a true interval scale. However, a large percentage of variables used in the social sciences are treated as if they are interval scales. It turns out that with a bit of fancy math, many ordinal variables can be transformed, weighted, and summed in such a way that the resulting score is reasonably close to having interval properties. The advantage of doing this is that, unlike with nominal and ordinal scales, you can calculate means, standard deviations, and a host of other statistics that depend on there being meaningful distances between numbers.
Psychological and educational measures regularly make use of these procedures. For example, on tests like the ACT, we take information about which questions were answered correctly and then transform the scores into a scale that ranges from 1 to 36. As a group, people who score a higher on the ACT tend to perform better in college than people who score lower. Of course, many individuals perform much better than their ACT scores suggest. An equal number of individuals perform much worse than their ACT scores suggest. Among many other things, thirst for knowledge and hard work matter quite a bit. Even so, on average, individuals with a 10 on the ACT are likely to perform worse in college than people with a 20. Roughly by the same amount, people with a 30 on the ACT are likely to perform better in college than people with a 20. Again, we talking about averages, not individuals. Every day, some people beat expectations and some people fail to meet them, often by wide margins.
Examples of Interval Scales
- Truly interval:
- Temperature on the Celsius and Fahrenheit scale (not on the Kelvin scale)
- Calendar year (e.g., 431BC, 1066AD)
- Notes on an even-tempered instrument such as a piano {A, A#, B, C, C#, D, D#, E, F, F#, G, G#}
- A ratio scale converted to a z-score metric (or any other kind of standard score metric)
- Nearly interval:
- Most scores from well-constructed ability tests (e.g., IQ, ACT, GRE) and personality measures (e.g., self-esteem, extroversion).
A z-score metric has a mean of 0 and a standard deviation of 1. Thus, the zero indicates the mean of the variable, not the absence of the quantity.
Ratio Scales
A ratio scale has all of the properties of an interval scale. In addition, it has a true zero. When a ratio scale has a value of zero, it indicates the absence of the quantity being measured. For example, if I say that I have 0 coins in my pocket, there are no coins in my pocket. The fact that ratio scales have true zeroes means that ratios are meaningful. For example, if you have 2 coins and I have one, you have twice as many coins as I do. If I have 100 coins and then you give me 10 more, the number of coins I have has increased by 10%.
Examples of Ratio Scales
Ratio scales involve countable quantities, such as:
- coins
- marbles
- computers
- speeding tickets
- pregnancies
- soldiers
- planets
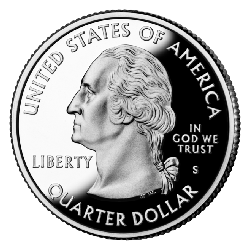
Countable quantities are discrete variables like the scale in Figure 3. Countable integers are discrete because they have particular values but not values between those values.
A discrete variable can only take on exact, isolated values from a specified list.
Many physical properties are also ratio scales, such as:
- distance
- mass
- force
- heat (on the Kelvin scale)
- pressure
- voltage
- acceleration
- proportions
These dimensions are not discrete countable quantities like cars and bricks but are instead continuous quantities that can be measured with decimals and fractions.

Notice that even though ratio variables have a true zero, on some of them it is possible to have negative numbers. For example, negative acceleration would indicate a slowing down. A negative value in a checking account means that you owe the bank money.
In the social sciences, there are many examples of ratio scales:
- Income
- Age
- Years of education
- Reaction time
- Family size
- Hours of study
- Percentage of household chores completed (compared to other members of the household)
Video Overview
If you missed the lecture on this topic, you can, outside of lab, review the material here:
Additional Reading
An expanded version of this tutorial can be seen in my free, online textbook.