
align(i = ~ Grade == "Total", j = "Grade") Making tables in APA style (Part 1 of 24)
In this 24-part series, each of the tables in Chapter 7 of the Publication Manual of the American Psychological Association (7th Edition) is recreated with apa7, flextable, easystats, and tidyverse functions.
NoteHighlights
- Row titles and styling with
apa_flextable - Conditional placement of cell borders with
flextable::surround - General notes with
flextable::add_footer_linesorapa-notechunk option - Footnotes with
flextable::footnote
When I write a research manuscript in APA style, I have twin goals that are sometimes at odds: 1) I want the document to be fully reproducible, including the tables. 2) I want the formatting to be not only correct but aesthetically pleasing.
The final frontier of reproducibility in APA style, for me, has been getting the tables right. At long last, I am getting close to where I want to be. My process usually goes like this:
- Wrangle data with tidyverse functions.
- Perform analyses, and format analysis tables with easystats functions.
- Perform table-specific data shaping with apa7 functions.
- Create a table with
apa7::apa_flextable. - Add specific formatting and finishing touches with flextable functions.
Sample Tables from the APA Manual
As an exercise, I decided to reproduce the sample tables in Chapter 7 of the APA Manual, which covers the display of tables. There are a number of differences between the original tables and the recreated tables.
- I stick with Times New Roman as my font.
- I add little breaks between column spanners in multilevel headers.
- I align decimals where possible.
Things I usually change, but I do not mess with here:
- I like column headings to have the same alignment as the body cells under them—if the cell is left justified, I want the header to be left justified. However, APA style usually has centered headings for everything.
- Hanging indents are useful sometimes, but I try to avoid them when they make the columns appear uneven. Some of the tables have hanging indents that could have been avoided, but I put them in anyway.
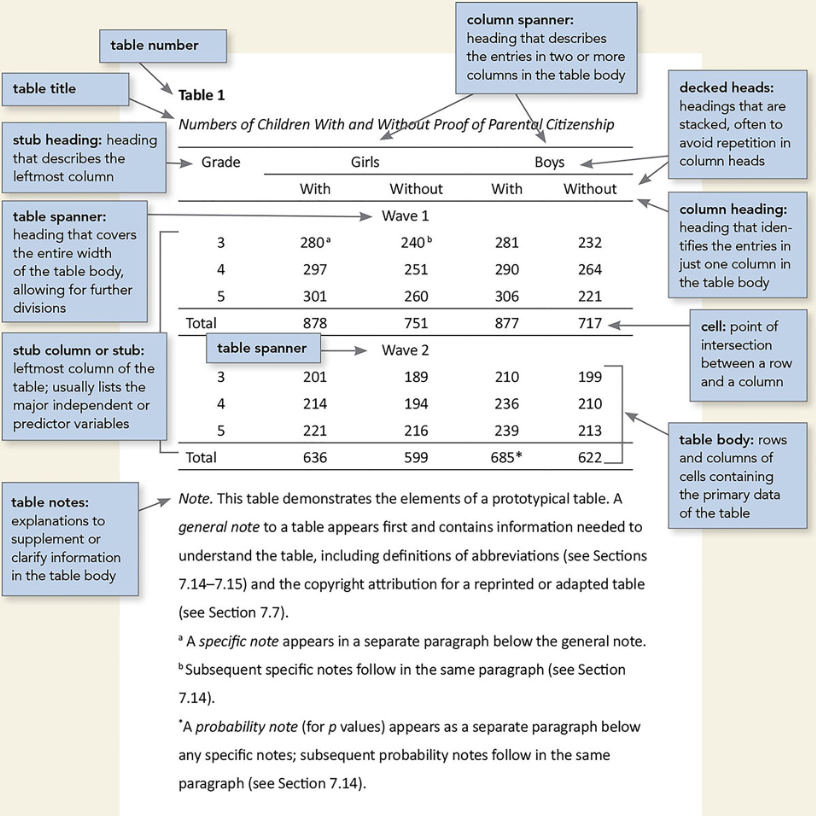
Figure 1 is a complex table, meant to illustrate the primary components of a table such as stub headings, column spanners, decked heads, table spanners, and table notes.
Figure 1
Screenshot of the APA Manual’s Table 7.1
To recreate the data for the table in Figure 1 requires a fair bit of work, most of which is not relevant to the display of the table. Table 1 displays the data in its raw form. I used flextable’s theme_apa (via set_flextable_defaults) to get the basic formatting to be consistent with APA format.
library(apa7)
library(flextable)
library(ftExtra)
library(tidyverse)
set_flextable_defaults(theme_fun = theme_apa,
                       font.family = "Times New Roman",
                       table_align = "left")


# Make and format data
d_citizenship <- crossing(
  Wave = 1:2,
  Citizenship = fct_inorder(c("With", "Without")),
  Gender = fct_inorder(c("Girls", "Boys")),
  Grade = 3:5
) |>
  mutate(n = as.integer(
    c(111, 297, 301,
      281, 290, 306,
      240, 251, 260,
      232, 264, 221,
      201, 214, 221,
      210, 236, 239,
      189, 194, 216,
      199, 210, 213))) |>
  arrange(Gender, Citizenship) |>
  unite(Gender_Citizenship, Gender, Citizenship) |>
  pivot_wider(names_from = Gender_Citizenship,
              values_from = n,
              names_vary = "slowest") |>
  mutate(Grade = factor(Grade)) %>%
  bind_rows(
    .,
    summarise(
      .,
      across(where(is.numeric),
             .fns = sum),
      .by = Wave) |>
      mutate(Grade = factor("Total"))) |>
  arrange(Wave, Grade)


flextable(d_citizenship)
Wave | Grade | Girls_With | Girls_Without | Boys_With | Boys_Without |
|---|---|---|---|---|---|
1 | 3 | 111 | 240 | 281 | 232 |
1 | 4 | 297 | 251 | 290 | 264 |
1 | 5 | 301 | 260 | 306 | 221 |
1 | Total | 709 | 751 | 877 | 717 |
2 | 3 | 201 | 189 | 210 | 199 |
2 | 4 | 214 | 194 | 236 | 210 |
2 | 5 | 221 | 216 | 239 | 213 |
2 | Total | 636 | 599 | 685 | 622 |
Table 1
Raw Table
However, Table 1 requires additional formatting to become publication-worthy. The apa_flextable function performs several layers of transformations before and after applying flextable, most of which can be turned off selectively.
The flextable::surround function can place cell borders selectively by row (or column). Table 2 is close to the final result, but additional notes are needed.
ft_71 <- d_citizenship |>
  apa_flextable(row_title_column = Wave,
                row_title_prefix = "Wave",
                row_title_align = "center",
                line_spacing = 1.5,
                table_width = 1) |>
  surround(i = ~ Grade == "Total",
           border.top = list(color = "gray",
                             width = 1,
                             style = "solid"))
ft_71
Grade | Girls | Boys | |||
|---|---|---|---|---|---|
With | Without | With | Without | ||
Wave 1 | |||||
3 | 111 | 240 | 281 | 232 | |
4 | 297 | 251 | 290 | 264 | |
5 | 301 | 260 | 306 | 221 | |
Total | 709 | 751 | 877 | 717 | |
Wave 2 | |||||
3 | 201 | 189 | 210 | 199 | |
4 | 214 | 194 | 236 | 210 | |
5 | 221 | 216 | 239 | 213 | |
Total | 636 | 599 | 685 | 622 | |
Table 2
Initial Results
The apa_flextable function does not delete the column specified in row_title_column (i.e., Wave), but it does remove it from display. An additional hidden column called row_title has data in the row titles but is NA in other rows. Both columns are available for programmatic formatting the row titles and row groupings. For example, here I bold the row titles and make all the Wave 3 text blue and with Arial font. In documents where deviations from strict APA style are allowed, such stylings can be useful to highlight a point.
ft_71 |>
  style(i = ~ Wave == 2,
                   pr_t = officer::fp_text(
                     color = "dodgerblue",
                     font.family = "Arial")) |>
  bold(i = ~ !is.na(row_title))
Grade | Girls | Boys | |||
|---|---|---|---|---|---|
With | Without | With | Without | ||
Wave 1 | |||||
3 | 111 | 240 | 281 | 232 | |
4 | 297 | 251 | 290 | 264 | |
5 | 301 | 260 | 306 | 221 | |
Total | 709 | 751 | 877 | 717 | |
Wave 2 | |||||
3 | 201 | 189 | 210 | 199 | |
4 | 214 | 194 | 236 | 210 | |
5 | 221 | 216 | 239 | 213 | |
Total | 636 | 599 | 685 | 622 | |
Table 3
Table with Conditional Formatting
Tables Notes
APA style distinguishes between three types of table notes, each of which need to be in separate paragraphs:
- General Note. Contains definitions, abbreviations, and other information needed to understand the table, as well as copyright information.
- Specific Note. These are notes about specific cells in the table, often in form of footnotes with lowercase letters as markers. Each footnote is in the same paragraph. The APA Manual recommends making the the footnote marker in superscript. The space that separates the marker from the the explanatory text should also be in superscript, hence the non-breaking space
^\u00A0^at the beginning of th footnote text. - Probability Note. This note explains the meanings of probability markers (e.g., * p < .05; ** p < .001; *** p < .001).
Adding Table Notes with flextable
Adding footnotes with flextable functions might look like a lot of code in Table 4, but it is mostly straightforward.
The general note can be created with the footer_lines function. The note itself can be written inside flextable::as_paragraph or ftExtra::as_paragraph_md. The ftExtra::as_paragraph_md function can make moderately complex formatting a little easier because it uses markdown syntax. If precise fine-tuning is needed, the flextable package has many formatting functions that can be used inside flextable::as_paragraph.
Getting everything to display in perfect APA style is not always possible with the footnote function. The footnotes are supposed to go in a single paragraph that is separate from the general note. We can make footnotes appear in their own paragraph by setting the inline argument in footnote to TRUE, but this makes the general note also in the same paragraph.
I did not use the footnote function to create the probability note because I did not want the asterisk to be in superscript. Instead the asterisk is placed in the table with the append_chunk function, and the probability note is added separately with the footer_lines function.
```{r}
#| label: tbl-71b
#| tbl-cap: Numbers of Children With and Without Proof of Parental Citizenship

d_citizenship |>
  apa_flextable(row_title_column = Wave,
                row_title_prefix = "Wave",
                row_title_align = "center",
                line_spacing = 1.5) |>
  surround(i = ~ Grade == "Total",
                      border.top = list(color = "gray",
                                        width = 1,
                                        style = "solid")) |>
  add_footer_lines(
  as_paragraph_md(
    "*Note*. This table demonstrates the elements of a
    prototypical table. A *general note* to a table appears
    first and contains information needed to understand the
    table, including definitions of abbreviations (see Sections
    7.14–7.15) and the copyright attribution for a reprinted or
    adapted table (see Section 7.7)."
  )
) |>
footnote(
  i = ~ Wave == 1 &
    Grade == 3,
  j = "Girls_With",
  value = as_paragraph_md(
    "^\u00A0^A *specific note* appears in a separate
      paragraph below the general note. "),
  ref_symbols = "a"
) |>
  footnote(
  i = ~ Wave == 1 &
    Grade == 3,
  j = "Girls_Without",
  value = as_paragraph_md(
    "^\u00A0^Subsequent specific notes follow in the
    same paragraph (see Section 7.14)."),
  ref_symbols = "b",
  inline = TRUE,
  sep = ""
) |>
add_footer_lines(
  values = as_paragraph_md(
    "\\* A *probability note* (for *p*-values) appears as a
    separate paragraph below any specific notes; subsequent
    probability notes follow in the same paragraph (see
    Section 7.14)."
    )) |>
  append_chunks(
    i = ~ Wave == 2 & Grade == "Total",
    j = "Boys_With",
    as_chunk("*")) |>
  line_spacing(space = 1.5, part = "footer")
```
Grade | Girls | Boys | |||
|---|---|---|---|---|---|
With | Without | With | Without | ||
Wave 1 | |||||
3 | 111a | 240b | 281 | 232 | |
4 | 297 | 251 | 290 | 264 | |
5 | 301 | 260 | 306 | 221 | |
Total | 709 | 751 | 877 | 717 | |
Wave 2 | |||||
3 | 201 | 189 | 210 | 199 | |
4 | 214 | 194 | 236 | 210 | |
5 | 221 | 216 | 239 | 213 | |
Total | 636 | 599 | 685* | 622 | |
Note. This table demonstrates the elements of a prototypical table. A general note to a table appears first and contains information needed to understand the table, including definitions of abbreviations (see Sections 7.14–7.15) and the copyright attribution for a reprinted or adapted table (see Section 7.7). | |||||
a A specific note appears in a separate paragraph below the general note.b Subsequent specific notes follow in the same paragraph (see Section 7.14). | |||||
* A probability note (for p-values) appears as a separate paragraph below any specific notes; subsequent probability notes follow in the same paragraph (see Section 7.14). | |||||
Table 4
Numbers of Children With and Without Proof of Parental Citizenship
Adding Table Notes with apaquarto’s apa-note Chunk Option
In some formats (e.g., .pdf), long table notes can mess with the column widths and make the table unreadable.
If you are rendering with the apaquarto extension, you can append table notes with the apa-note chunk option. Recent versions of apaquarto can separate apa-note text into multiple paragraphs as shown in the chunk below.
Also, it bothers me that the footnote symbols mess up the number alignment. I decided to add them in myself. In the same columns that have footnotes, I padded the numbers that do not have footnotes with the numbsp; character (Figure Space) to maintain the alignment.
As a final polishing move, I rejiggered the column widths to make everything center correctly. Table 5 is as good as I can make a table in APA Style.
```{r}
#| label: tbl-71c
#| image-preview: true
#| tbl-cap: Numbers of Children With and Without Proof of Parental Citizenship
#| apa-note:
#|   - This table demonstrates the elements of a prototypical
#|     table. A *general note* to a table appears first and
#|     contains information needed to understand the table,
#|     including definitions of abbreviations (see Sections
#|     7.14--7.15) and the copyright attribution for a
#|     reprinted or adapted table (see Section 7.7).
#|   - ^a^ Subsequent specific notes follow in the same
#|     paragraph (see Section 7.14). ^b^ Subsequent specific
#|     notes follow in the same paragraph (see Section 7.14).
#|   - \* A *probability note* (for *p* values) appears as a
#|     separate paragraph below any specific notes; subsequent
#|     probability notes follow in the same paragraph (see
#|     Section 7.14).

d_citizenship |>
  mutate(Girls_With = paste0(
    "^ ^",
    Girls_With,
    ifelse(Wave == 1 & Grade == 3,
           "^a^",
           "^ ^")),
    Girls_Without = paste0(
      "^ ^",
    Girls_Without,
    ifelse(Wave == 1 & Grade == 3,
           "^b^",
           "^ ^")),
    Boys_With = paste0(
      "^ ^",
    Boys_With,
    ifelse(Wave == 2 & Grade == "Total",
           "^\\*^",
           "^ ^"))
    ) |>
  apa_flextable(row_title_column = Wave,
                row_title_prefix = "Wave",
                row_title_align = "center",
                table_width = 1,
                line_spacing = 1.5,
                layout = "fixed") |>
    surround(i = ~ Grade == "Total",
                      border.top = list(color = "gray",
                                        width = 1,
                                        style = "solid")) |>
  width(width = c(1.34, 1.28, 1.28, .05, 1.28, 1.28))
```
Grade | Girls | Boys | |||
|---|---|---|---|---|---|
With | Without | With | Without | ||
Wave 1 | |||||
3 | 111a | 240b | 281 | 232 | |
4 | 297 | 251 | 290 | 264 | |
5 | 301 | 260 | 306 | 221 | |
Total | 709 | 751 | 877 | 717 | |
Wave 2 | |||||
3 | 201 | 189 | 210 | 199 | |
4 | 214 | 194 | 236 | 210 | |
5 | 221 | 216 | 239 | 213 | |
Total | 636 | 599 | 685* | 622 | |
Table 5
Numbers of Children With and Without Proof of Parental Citizenship
Note. This table demonstrates the elements of a prototypical table. A general note to a table appears first and contains information needed to understand the table, including definitions of abbreviations (see Sections 7.14–7.15) and the copyright attribution for a reprinted or adapted table (see Section 7.7).
a Subsequent specific notes follow in the same paragraph (see Section 7.14). b Subsequent specific notes follow in the same paragraph (see Section 7.14).
* A probability note (for p values) appears as a separate paragraph below any specific notes; subsequent probability notes follow in the same paragraph (see Section 7.14).
Note that in Figure 1, the Total row is left-aligned in the Grade column. I did not do this because I think it looks bad, and there was no note saying that I had to do it to remain in strict APA style. If you think you need it, you would add this line to your table pipeline:
Citation
BibTeX citation:
@misc{schneider2025,
  author = {Schneider, W. Joel},
  title = {Recreating {APA} {Manual} {Table} 7.1 in {R} with Apa7},
  date = {2025-09-10},
  url = {https://wjschne.github.io/posts/apatables/apa701.html},
  langid = {en}
}
For attribution, please cite this work as:
Schneider, W. J. (2025, September 10). Recreating APA Manual Table 7.1
in R with apa7. Schneirographs. https://wjschne.github.io/posts/apatables/apa701.html