
library(apa7)
library(flextable)
library(ftExtra)
library(tidyverse)
set_flextable_defaults(theme_fun = theme_apa,
font.family = "Times New Roman")Making tables in APA style (Part 6 of 24)
In this 24-part series, each of the tables in Chapter 7 of the Publication Manual of the American Psychological Association (7th Edition) is recreated with apa7, flextable, easystats, and tidyverse functions.
NoteHighlights
- Centering text on a space rather than a decimal with
align_chr - Automatic column formatting with
apa-format_columns
Figure 1
Screenshot of the APA Manual’s Table 7.6
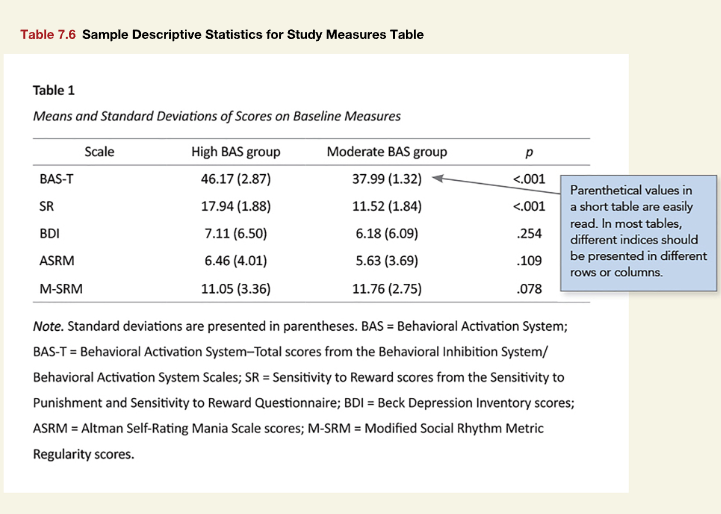
To simply enter the data from this table would be a straightforward process. To make things interesting, I am going simulate data from the group means and standard deviations, run a series of t-tests, and display the data. This makes the process much more like what would happen in a real write-up. The means, standard deviations, and p-values come from the simulated data, not from Figure 1.
Normally non-significant p-values would be rounded to 2 digits, but they were rounded to 3 digits via apa_format_columns, which also italicized the p column. The apa_format_columns is invoked by apa_flextable, but sometimes we want to take care of some custom formatting ahead of that step.
The two middle columns are aligned on the space between the group means and standard deviations, via align_chr(x, center = " ").
```{r}
#| label: tbl-76
#| tbl-cap: Means and Standard Deviations of Scores on Baseline Measures
#| apa-note: Standard deviations are presented in parentheses.
#|           BAS = Behavioral Activation System;
#|           BAS-T = Behavioral Activation System–Total
#|           scores from the Behavioral Inhibition System/Behavioral
#|           Activation System Scales; SR = Sensitivity
#|           to Reward scores from the Sensitivity
#|           to Punishment and Sensitivity to Reward Questionnaire;
#|           BDI = Beck Depression Inventory scores;
#|           ASRM = Altman Self-Rating Mania Scale scores;
#|           M-SRM = Modified Social Rhythm Metric
#|           Regularity scores.
set.seed(12)

# make data
d <- tibble::tribble(
   ~Scale,     ~Group,    ~M,  ~SD,
  "BAS-T",     "High", 46.17, 2.87,
     "SR",     "High", 17.94, 1.88,
    "BDI",     "High",  7.11,  6.5,
   "ASRM",     "High",  6.46, 4.01,
  "M-SRM",     "High", 11.05, 3.36,
  "BAS-T", "Moderate", 37.99, 1.32,
     "SR", "Moderate", 11.52, 1.84,
    "BDI", "Moderate",  6.18, 6.09,
   "ASRM", "Moderate",  5.63, 3.69,
  "M-SRM", "Moderate", 11.76, 2.75
  ) |>
  mutate(x = map2(M, SD, \(m, s) rnorm(75, mean = m, sd = s))) |>
  unnest(x) |>
  nest(data = -Scale)

# Analyze data
d_analysis <- d |>
  mutate(
    descriptives = map(
      data,
      \(d) select(d, Group, x) |>
        summarise(m = mean(x) , s = sd(x), .by = Group) |>
        mutate(value = paste0(
          scales::number(m, accuracy = .01),
          " (",
          scales::number(s, accuracy = .01),
          ")"
        )) |>
        select(-c(m, s)) |>
        mutate(Group = paste0(Group, " BAS group")) |>
        pivot_wider(names_from = Group)
    ),
    p = map_dbl(data, \(d) {
      t.test(x ~ Group, data = d)$p.value
    }),
  ) |>
  select(-data) |>
  unnest(descriptives)

# Format data
d_formatted <- d_analysis |>
  mutate(across(-c(Scale), \(x) align_chr(x, center = " "))) |>
  apa_format_columns(accuracy = .001)

# Make table
d_formatted |>
  apa_flextable(table_width = 1,
                layout = "fixed",
                line_spacing = 1.5) |>
  width(width = rep(6.5 / 4, 4))
```
Scale | High BAS group | Moderate BAS group | p |
|---|---|---|---|
BAS-T | 46.14 (2.60) | 37.95 (1.22) | <.001 |
SR | 17.93 (1.80) | 11.24 (1.82) | <.001 |
BDI | 6.89 (6.48) | 5.67 (5.46) | .210 |
ASRM | 6.38 (3.96) | 5.30 (3.63) | .080 |
M-SRM | 10.92 (3.10) | 11.70 (2.76) | .100 |
Table 1
Means and Standard Deviations of Scores on Baseline Measures
Note. Standard deviations are presented in parentheses. BAS = Behavioral Activation System; BAS-T = Behavioral Activation System–Total scores from the Behavioral Inhibition System/Behavioral Activation System Scales; SR = Sensitivity to Reward scores from the Sensitivity to Punishment and Sensitivity to Reward Questionnaire; BDI = Beck Depression Inventory scores; ASRM = Altman Self-Rating Mania Scale scores; M-SRM = Modified Social Rhythm Metric Regularity scores.
Citation
BibTeX citation:
@misc{schneider2025,
  author = {Schneider, W. Joel},
  title = {Recreating {APA} {Manual} {Table} 7.6 in {R} with Apa7},
  date = {2025-09-16},
  url = {https://wjschne.github.io/posts/apatables/apa706.html},
  langid = {en}
}
For attribution, please cite this work as:
Schneider, W. J. (2025, September 16). Recreating APA Manual Table 7.6
in R with apa7. Schneirographs. https://wjschne.github.io/posts/apatables/apa706.html