
library(apa7)
library(flextable)
library(ftExtra)
library(tidyverse)
set_flextable_defaults(theme_fun = theme_apa,
font.family = "Times New Roman")Making tables in APA style (Part 7 of 24)
In this 24-part series, each of the tables in Chapter 7 of the Publication Manual of the American Psychological Association (7th Edition) is recreated with apa7, flextable, easystats, and tidyverse functions.
NoteHighlights
- Convert p-values to stars and append them to chi-square statistic with
add_star_column - Add p-value note with
flextable::add_footer_lines - Hanging indent with
hanging_indent
Figure 1
Screenshot of the APA Manual’s Table 7.7
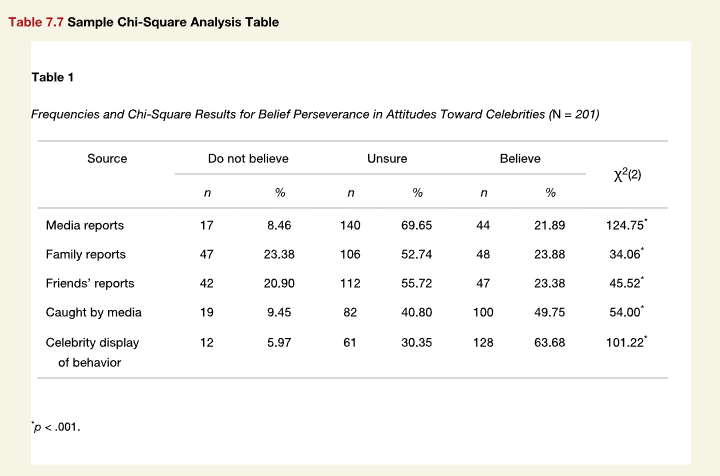
I could have just copied the table directly, but I decided to illustrate how one might calculate percentages and chi-square tests results from the sample sizes.
```{r}
#| label: tbl-77
#| tbl-cap: "Frequencies and Chi-Square Results for
#| Belief Perseverance in Attitudes Toward
#| Celebrities (*N* = 201)"
# Make data
d <- "
Source Do not believe Unsure Believe
Media reports 17 140 44
Family reports 47 106 48
Friends' reports 42 112 47
Caught by media 19 82 100
Celebrity display of behavior 12 61 128" |>
readr::read_tsv(show_col_types = FALSE)
# Format data
d_formatted <- d |>
pivot_longer(-c(Source), values_to = "n") |>
mutate(name = fct_inorder(name)) |>
mutate(`%` = scales::number(100 * `n` / sum(`n`), accuracy = .01),
.by = Source) |>
nest(data = -Source, .by = Source) |>
mutate(
fit = map(data, \(dd) {
chisq.test(dd$n)
}),
chisq = map_dbl(fit, "statistic"),
p = map_dbl(fit, "p.value")
) |>
select(-fit) |>
unnest(data) |>
pivot_wider_name_first(values_from = c(`n`, `%`)) |>
relocate(chisq, .after = dplyr::last_col()) |>
mutate(across(-Source, align_chr)) |>
mutate(Source = hanging_indent(Source, width = 18)) |>
add_star_column(chisq, alpha = .001, merge = TRUE) |>
select(-p) |>
rename(`χ^2^(2)` = chisq)
# Make table
d_formatted |>
apa_flextable(table_width = 1, layout = "fixed") |>
width(width = c(1.6, rep(c(.65,.65, .05), 3)[-9], .9)) |>
add_footer_lines(values = as_paragraph_md("^\\*^*p* < .001"))
```Source | Do not believe | Unsure | Believe | χ2(2) | |||||
|---|---|---|---|---|---|---|---|---|---|
n | % | n | % | n | % | ||||
Media reports | 17 | 8.46 | 140 | 69.65 | 44 | 21.89 | 124.75* | ||
Family reports | 47 | 23.38 | 106 | 52.74 | 48 | 23.88 | 34.06* | ||
Friends’ reports | 42 | 20.90 | 112 | 55.72 | 47 | 23.38 | 45.52* | ||
Caught by media | 19 | 9.45 | 82 | 40.80 | 100 | 49.75 | 54.00* | ||
Celebrity display | 12 | 5.97 | 61 | 30.35 | 128 | 63.68 | 101.22* | ||
*p < .001 | |||||||||
Table 1
Frequencies and Chi-Square Results for Belief Perseverance in Attitudes Toward Celebrities (N = 201)
Citation
BibTeX citation:
@misc{schneider2025,
  author = {Schneider, W. Joel},
  title = {Recreating {APA} {Manual} {Table} 7.7 in {R} with Apa7},
  date = {2025-09-17},
  url = {https://wjschne.github.io/posts/apatables/apa707.html},
  langid = {en}
}
For attribution, please cite this work as:
Schneider, W. J. (2025, September 17). Recreating APA Manual Table 7.7
in R with apa7. Schneirographs. https://wjschne.github.io/posts/apatables/apa707.html