
library(apa7)
library(flextable)
library(ftExtra)
library(tidyverse)
library(signs)
set_flextable_defaults(theme_fun = theme_apa,
font.family = "Times New Roman")Making tables in APA style (Part 8 of 24)
In this 24-part series, each of the tables in Chapter 7 of the Publication Manual of the American Psychological Association (7th Edition) is recreated with apa7, flextable, easystats, and tidyverse functions.
NoteHighlights
- Pre-formatting columns and turning off auto-formatting
- Intentional use of inconsistent rounding within columns
Figure 1
Screenshot of the APA Manual’s Table 7.8
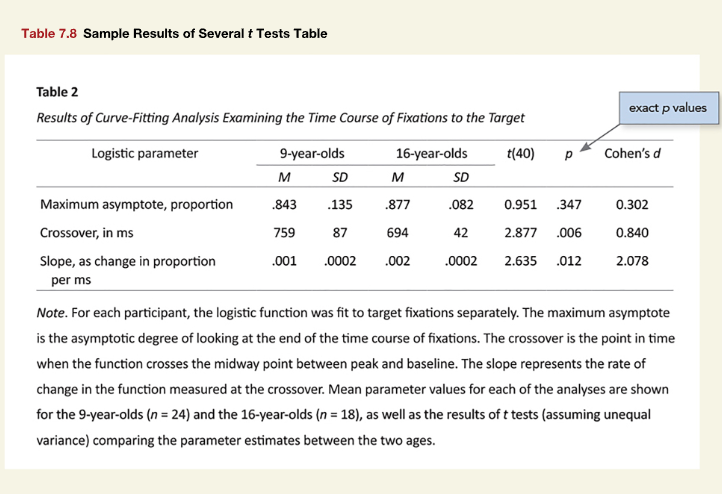
If it were simply a matter of copying the text into the table, this would be fairly simple. However, in a real analysis, the text does not come pre-formatted. Thus, I simulated the data first, and then proceeded as if I had to conduct the t-tests and report the results from scratch.
For this one, the trick is to get the rounding right for the means and standard deviations. Each row is on a different scale, and needs different rounding rules. The easiest way I could do this was to first apply regular rounding with round and then round to a set number of significant digits with formatC.
Normally, I would respect the direction of the effect, but Figure 1 makes t and Cohen’s d positive for all three rows despite the change in direction for the middle row.
```{r}
#| label: tbl-78
#| tbl-cap: Results of Curve-Fitting Analysis Examining the
#|          Time Course of Fixations to the Target
#| apa-note: "For each participant, the logistic function was
#|           fit to target fixations separately. The maximum
#|           asymptote is the asymptotic degree of looking at
#|           the end of the time course of fixations. The
#|           crossover point is the point in time the function
#|           crosses the midway point between peak and baseline.
#|           The slope represents the rate of change in the
#|           function measured at the crossover. Mean parameter
#|           values for each of the analyses are shown for the
#|           9-year-olds (*n* = 24) and 16-year-olds (*n* = 18),
#|           as well as the results of t tests (assuming unequal
#|           variance) comparing the parameter estimates between
#|           the two ages."
set.seed(10)

# Make data
d <- tibble::tribble(
                      ~`Logistic Parameter`, ~Age,    ~M,    ~SD,
          "Maximum asymptote, proportion",   9L, 0.843,  0.135,
                       "Crossover, in ms",   9L,   759,     87,
  "Slope, as change in proportion per ms",   9L, 0.001,  .0002,
          "Maximum asymptote, proportion",  16L, 0.877,  0.082,
                       "Crossover, in ms",  16L,   694,     42,
  "Slope, as change in proportion per ms",  16L, 0.002,  .0002
  ) |>
  mutate(n = ifelse(Age == 9L, 24, 18)) |>
  mutate(x = pmap(list(M, SD, n),
                  \(M, SD, n) rnorm(n, M, SD))) |>
  select(data = -c(M,SD, n)) |>
  unnest(x) |>
  nest(data = -`Logistic Parameter`)

# Analyze data
d_analysis <- d |>
  mutate(t_fit = map(data, \(d) t.test(
    x ~ Age, data = d)),
         cohen = map(data, \(d) effectsize::cohens_d(
           x ~ Age,
           data = d))) |>
  unnest(cohen)

# Format data
d_formatted <- d_analysis |>
  select(-starts_with("CI")) |>
  mutate(`t(40)` = map_dbl(t_fit, "statistic") |>
           abs() |>
           align_chr(accuracy = .001),
         p = map_dbl(t_fit, "p.value"),
         .before = Cohens_d) |>
  select(-t_fit) |>
  mutate(data = pmap(
    list(d = data,
         round_digits = c(3, 0, 4),
         sig_digits = c(3, 3, 1)),
    \(d, round_digits, sig_digits) {
      d |>
        summarise(M = mean(x),
                  SD = sd(x),
                  .by = Age) |>
        mutate(across(c(M, SD), \(x) {
          round(x, round_digits) |>
            formatC(digits = sig_digits) |>
            trimws() |>
            str_remove("^0")
          }))
  })) |>
  unnest(data) |>
  mutate(Age = paste0(Age, "-year-olds"),
         Cohens_d = signs(abs(Cohens_d),
                                 accuracy = .001)) |>
  pivot_wider_name_first(
    values_from = c(M, SD),
    names_from = Age) |>
  select(`Logistic Parameter`,
         contains("olds"),
         everything()) |>
  mutate(`Logistic Parameter` = hanging_indent(`Logistic Parameter`))


# Make table
d_formatted |>
  apa_flextable(
    no_format_columns = contains("olds"),
    column_formats = column_formats(accuracy = .001))
```
Logistic Parameter | 9-year-olds | 16-year-olds | t(40) | p | Cohen’s d | |||
|---|---|---|---|---|---|---|---|---|
M | SD | M | SD | |||||
Maximum asymptote, proportion | .805 | .127 | .882 | .086 | 2.325 | .025 | 0.687 | |
Crossover, in ms | 722 | 70 | 691 | 39 | 1.802 | .080 | 0.521 | |
Slope, as change in proportion | .001 | .0002 | .002 | .0002 | 18.671 | <.001 | 5.748 | |
Table 1
Results of Curve-Fitting Analysis Examining the Time Course of Fixations to the Target
Note. For each participant, the logistic function was fit to target fixations separately. The maximum asymptote is the asymptotic degree of looking at the end of the time course of fixations. The crossover point is the point in time the function crosses the midway point between peak and baseline. The slope represents the rate of change in the function measured at the crossover. Mean parameter values for each of the analyses are shown for the 9-year-olds (n = 24) and 16-year-olds (n = 18), as well as the results of t tests (assuming unequal variance) comparing the parameter estimates between the two ages.
Citation
BibTeX citation:
@misc{schneider2025,
  author = {Schneider, W. Joel},
  title = {Recreating {APA} {Manual} {Table} 7.8 in {R} with Apa7},
  date = {2025-09-18},
  url = {https://wjschne.github.io/posts/apatables/apa708.html},
  langid = {en}
}
For attribution, please cite this work as:
Schneider, W. J. (2025, September 18). Recreating APA Manual Table 7.8
in R with apa7. Schneirographs. https://wjschne.github.io/posts/apatables/apa708.html