
library(apa7)
library(flextable)
library(ftExtra)
library(tidyverse)
set_flextable_defaults(theme_fun = theme_apa,
font.family = "Times New Roman")Making tables in APA style (Part 9 of 24)
In this 24-part series, each of the tables in Chapter 7 of the Publication Manual of the American Psychological Association (7th Edition) is recreated with apa7, flextable, easystats, and tidyverse functions.
NoteHighlights
- Use custom
column_formats - Use
footnote
Figure 1
Screenshot of the APA Manual’s Table 7.9
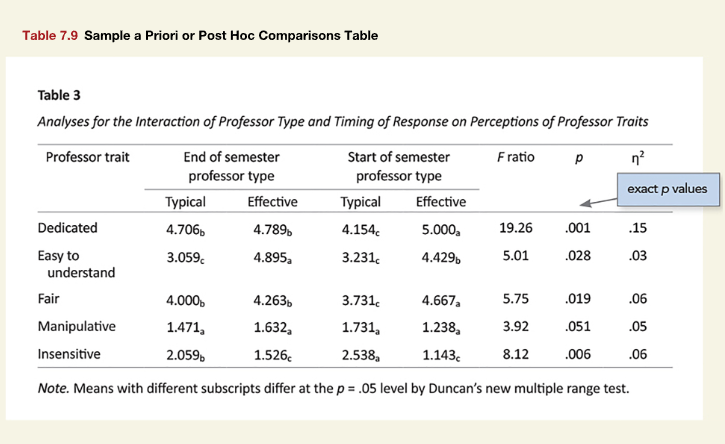
Setting up the data was harder than creating the table. Once the data were ready, I needed to set the rounding of the variables and alter the column header of the F column.
The column_formats function creates a modifiable copy of the default column formatters. After creating a column_formats object, I set the rounding accuracy of column p to .001 using [purrr::partial], which creates a copy of a function with new defaults.
I also set the header of the F column to *F* ratio.
```{r}
#| label: tbl-79
#| tbl-cap: "Analyses for the Interaction of Professor
#|           Type and Timing of Response on Perceptions
#|           of Professor Traits"
#| apa-note: "Means with different subscripts differ at
#|            the *p* = .05 level by Duncan’s
#|            new multiple range test."

# Descriptives
d_mean <- "
Professor trait     Semester    Type        Mean    Subscript
Dedicated           End         Typical     4.706   b
Easy to understand  End         Typical     3.059   c
Fair                End         Typical     4.000   b
Manipulative        End         Typical     1.471   a
Insensitive         End         Typical     2.059   b
Dedicated           End         Effective   4.789   b
Easy to understand  End         Effective   4.895   a
Fair                End         Effective   4.263   b
Manipulative        End         Effective   1.632   a
Insensitive         End         Effective   1.526   c
Dedicated           Start       Typical     4.154   c
Easy to understand  Start       Typical     3.231   c
Fair                Start       Typical     3.731   c
Manipulative        Start       Typical     1.731   a
Insensitive         Start       Typical     2.538   a
Dedicated           Start       Effective   5.000   a
Easy to understand  Start       Effective   4.429   b
Fair                Start       Effective   4.667   a
Manipulative        Start       Effective   1.238   a
Insensitive         Start       Effective   1.143   c" |>
    readr::read_tsv() |>
  suppressMessages()

# Statistics
d_test <- "
Professor trait     F       p       eta2
Dedicated           19.26   0.001   0.15
Easy to understand  5.01    0.028   0.03
Fair                5.75    0.019   0.06
Manipulative        3.92    0.051   0.05
Insensitive         8.12    0.006   0.06" |>
  readr::read_tsv() |>
  suppressMessages()

# Format data
d_formatted <- d_mean |>
  mutate(Semester = paste0(
    Semester,
    " of semester\\\nprofessor type")) |>
  mutate(Mean = scales::number(Mean, accuracy = .001),
         Subscript = paste0("~", Subscript, "~")) |>
  unite(Mean, c(Mean, Subscript), sep = "") |>
  unite(Semester, c(Semester, Type)) |>
  pivot_wider(names_from = Semester,
              values_from = Mean) |>
  left_join(d_test, by = join_by(`Professor trait`))


# custom formatter
my_formatter <-  column_formats()

## change p column's accuracy to 0.001
my_formatter$p@formatter <- my_formatter$p@formatter |>
  purrr::partial(accuracy = .001)

## set F column header to "*F* ratio"
my_formatter$`F`@header <- "*F* ratio"

# Make table
apa_flextable(d_formatted, column_formats = my_formatter)
```
Professor trait | End of semester | Start of semester | F ratio | p | η2 | |||
|---|---|---|---|---|---|---|---|---|
Typical | Effective | Typical | Effective | |||||
Dedicated | 4.706b | 4.789b | 4.154c | 5.000a | 19.26 | .001 | .15 | |
Easy to understand | 3.059c | 4.895a | 3.231c | 4.429b | 5.01 | .028 | .03 | |
Fair | 4.000b | 4.263b | 3.731c | 4.667a | 5.75 | .019 | .06 | |
Manipulative | 1.471a | 1.632a | 1.731a | 1.238a | 3.92 | .051 | .05 | |
Insensitive | 2.059b | 1.526c | 2.538a | 1.143c | 8.12 | .006 | .06 | |
Table 1
Analyses for the Interaction of Professor Type and Timing of Response on Perceptions of Professor Traits
Note. Means with different subscripts differ at the p = .05 level by Duncan’s new multiple range test.
Citation
BibTeX citation:
@misc{schneider2025,
  author = {Schneider, W. Joel},
  title = {Recreating {APA} {Manual} {Table} 7.9 in {R} with Apa7},
  date = {2025-09-19},
  url = {https://wjschne.github.io/posts/apatables/apa709.html},
  langid = {en}
}
For attribution, please cite this work as:
Schneider, W. J. (2025, September 19). Recreating APA Manual Table 7.9
in R with apa7. Schneirographs. https://wjschne.github.io/posts/apatables/apa709.html