
library(apa7)
library(flextable)
library(ftExtra)
library(tidyverse)
set_flextable_defaults(theme_fun = theme_apa,
font.family = "Times New Roman")Making tables in APA style (Part 12 of 24)
In this 24-part series, each of the tables in Chapter 7 of the Publication Manual of the American Psychological Association (7th Edition) is recreated with apa7, flextable, easystats, and tidyverse functions.
NoteHighlights
- Selective indentation with
flextable::padding - Aligned significance stars with
add_star_column
Figure 1
Screenshot of the APA Manual’s Table 7.12
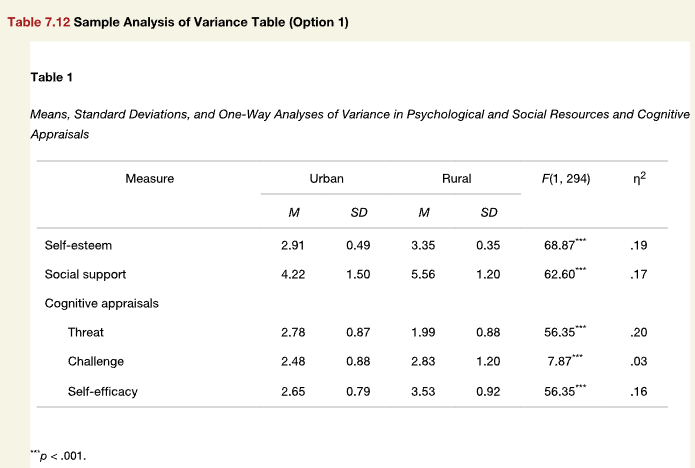
To make the process more realistic, I simulated data using the means and standard deviations from Figure 1, calculated descriptive statistics, conducted one-way ANOVAs, and extracted significance tests and effect sizes.
Note that the F column’s stars were added using the add_star_column function, which looks for a column called p, and converts p-values to stars.
set.seed(123)

# Make data
d_descriptives <- "
Measure                 Urban_M Urban_SD        Rural_M     Rural_SD
Self-esteem             2.91        0.49        3.35        0.35
Social support          4.22        1.50        5.56        1.20
Threat                  2.78        0.87        1.99        0.88
Challenge               2.48        0.88        2.83        1.20
Self-efficacy           2.65        0.79        3.53        0.92" |>
  readr::read_tsv() |>
  suppressMessages() |>
  pivot_longer(-Measure) |>
  separate(name, c("type", "name")) |>
  pivot_wider() |>
  mutate(data = map2(M, SD, \(m,sd) rnorm(148, m, sd))) |>
  select(Measure, type, data) |>
  unnest(data) |>
  rename(y = data) |>
  nest(.by = Measure)

# Analysis
d_analysis <- d_descriptives |>
  mutate(
    msd = map(data, \(d) {
      d |>
        summarise(M = mean(y),
                  SD = sd(y),
                  .by = type)
    }),
    fit = map(data, \(d) aov(y ~ type, data = d)),
    mp = map(fit, \(fit) {
      parameters::model_parameters(fit) |>
        as_tibble() |>
        slice(1)
      }
      ),
    `F` = map_dbl(mp, "F"),
    p = map_dbl(mp, "p"),
    eta2 = map_dbl(fit, \(fit) {
      eta2 <- suppressMessages(
        effectsize::effectsize(fit, type = "eta2" ))

      as_tibble(eta2)$Eta2

        }))

# Get residual degrees of freedom
df_residual <- d_analysis$fit[[1]]$df.residual

# Format data
d_formatted <- d_analysis |>
  unnest(msd) |>
  pivot_wider_name_first(names_from = type,
                         values_from = c(M, SD)) |>
  select(Measure, contains("_"), `F`, p, eta2)  |>
  mutate(`F` = align_chr(`F`)) |>
  add_star_column(`F`, merge = TRUE) |>
  select(-p) |>
  rename_with(\(x) ifelse(x == "F",
                          paste0("*F*(1,", df_residual, ")"),
                          x)) |>
  dplyr::add_row(Measure = "Cognitive appraisals", .after = 2)

# Make table
d_formatted |>
  apa_flextable() |>
  padding(i = 4:6, j = 1, padding.left = 20) |>
  width(width = c(1.65, .8, .8, .05, .8, .8, .9, .7))
Measure | Urban | Rural | F(1,294) | η2 | |||
|---|---|---|---|---|---|---|---|
M | SD | M | SD | ||||
Self-esteem | 2.90 | 0.46 | 3.38 | 0.33 | 109.38*** | .27 | |
Social support | 4.20 | 1.55 | 5.61 | 1.13 | 79.88*** | .21 | |
Cognitive appraisals | |||||||
Threat | 2.71 | 0.88 | 2.09 | 0.95 | 34.57*** | .11 | |
Challenge | 2.51 | 0.93 | 2.82 | 1.13 | 6.61* | .02 | |
Self-efficacy | 2.66 | 0.79 | 3.50 | 0.89 | 72.78*** | .20 | |
Table 1
Means, Standard Deviations, and One-Way Analyses of Variance in Psychological and Social Resources and Cognitive Appraisals
* p < .05; ** p < .01 *** p < .001
Citation
BibTeX citation:
@misc{schneider2025,
  author = {Schneider, W. Joel},
  title = {Recreating {APA} {Manual} {Table} 7.12 in {R} with Apa7},
  date = {2025-09-22},
  url = {https://wjschne.github.io/posts/apatables/apa712.html},
  langid = {en}
}
For attribution, please cite this work as:
Schneider, W. J. (2025, September 22). Recreating APA Manual Table 7.12
in R with apa7. Schneirographs. https://wjschne.github.io/posts/apatables/apa712.html