
library(apa7)
library(flextable)
library(ftExtra)
library(tidyverse)
set_flextable_defaults(theme_fun = theme_apa,
font.family = "Times New Roman")Making tables in APA style (Part 11 of 24)
In this 24-part series, each of the tables in Chapter 7 of the Publication Manual of the American Psychological Association (7th Edition) is recreated with apa7, flextable, easystats, and tidyverse functions.
NoteHighlights
- The
separate_star_columnfunction to align numbers with significance stars - The add_list_column function to make an ordered list.
Figure 1
Screenshot of the APA Manual’s Table 7.11
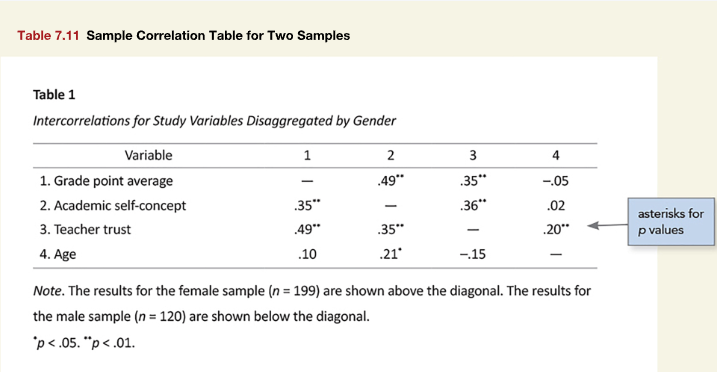
This correlation matrix is different above and below the diagonal. A correctable imperfection of the Figure 1 is that the correlations do not align on their decimals due to the minus signs and stars. This can be corrected by separating the correlations from the significance stars with the separate_star_column function. This function removes any stars from each selected column and places them in an adjacent column. The apa_flextable function (via apa_style) then automatically right aligns the selected columns and left aligns the star columns, and removes any padding between them, giving the illusion that they are in the same column with decimal alignment.
The add_list_column function can make ordered lists (numeric, alphabetical, or Roman numeral). By default, the list column is a separate column that is specially formatted by apa_flextable or apa_style. Setting merge = TRUE joins the list and text columns into a single column.
# Make data
d <- "
Variable                1       2       3       4
Grade point average     —       .49**   .35**   −.05
Academic self-concept   .35**   —       .36**   .02
Teacher trust           .49**   .35**   —       .20**
Age                     .10     .21*    −.15    —" |>
  readr::read_tsv() |>
  suppressMessages()

# Format data
d_formatted <- d |>
  separate_star_column(-Variable) |>
  add_list_column(Variable, merge = TRUE)


# Make Table
d_formatted |>
  apa_flextable(no_format_columns = Variable) |>
  width(width = c(2.1, rep(c(.7, .4), 4)))
Variable | 1 | 2 | 3 | 4 | ||||
|---|---|---|---|---|---|---|---|---|
1. Grade point average | — | .49 | ** | .35 | ** | −.05 | ||
2. Academic self-concept | .35 | ** | — | .36 | ** | .02 | ||
3. Teacher trust | .49 | ** | .35 | ** | — | .20 | ** | |
4. Age | .10 | .21 | * | −.15 | — |
Table 1
Intercorrelations for Study Variables Disaggregated by Gender
Note. The results for the female sample (n = 199) are shown above the diagonal. The results for the male sample (n = 120) are shown below the diagonal.
Citation
BibTeX citation:
@misc{schneider2025,
  author = {Schneider, W. Joel},
  title = {Recreating {APA} {Manual} {Table} 7.11 in {R} with Apa7},
  date = {2025-09-21},
  url = {https://wjschne.github.io/posts/apatables/apa711.html},
  langid = {en}
}
For attribution, please cite this work as:
Schneider, W. J. (2025, September 21). Recreating APA Manual Table 7.11
in R with apa7. Schneirographs. https://wjschne.github.io/posts/apatables/apa711.html