
library(apa7)
library(flextable)
library(ftExtra)
library(tidyverse)
set_flextable_defaults(theme_fun = theme_apa,
font.family = "Times New Roman")Making tables in APA style (Part 16 of 24)
In this 24-part series, each of the tables in Chapter 7 of the Publication Manual of the American Psychological Association (7th Edition) is recreated with apa7, flextable, easystats, and tidyverse functions.
NoteHighlights
- Two levels of grouping with
flextable::as_grouped_data
Figure 1
Screenshot of the APA Manual’s Table 7.16
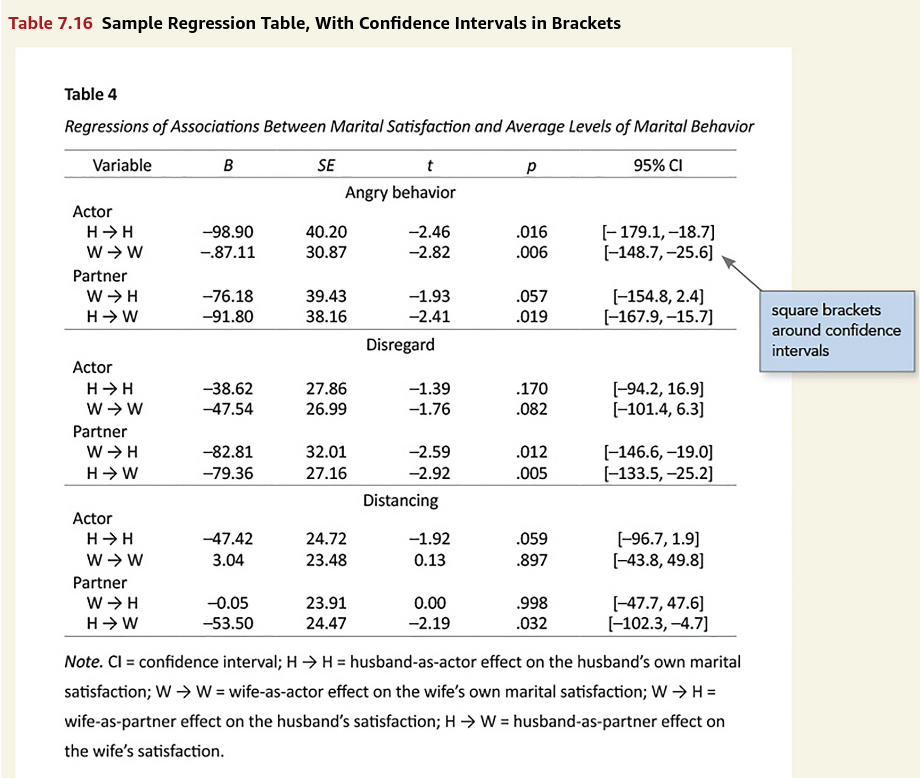
Here I simulate and analyze path models of the actor-partner interdependence model. Getting the row titles to be centered under the t column took some trial-and-error.
```{r}
#| label: tbl-716
#| tbl-cap: "Regressions of Associations Between Marital
#|           Satisfaction and Average Levels of Marital Behavior"
#| apa-note: "CI = confidence interval; H → H = husband-as-actor
#|           effect on the husband’s own marital satisfaction;
#|           W → W = wife-as-actor effect on the wife's own marital
#|           satisfaction; W → H = wife-as-partner effect on the
#|           husband’s satisfaction; H → W = husband-as-partner
#|           effect on the wife's satisfaction."
set.seed(123)
# Make Coefficients
d_coefficients <- tibble::tribble(
        ~Dependent,    ~Group, ~Predictor,     ~b,
  "Angry Behavior",   "Actor",       "H_H",  -98.9,
  "Angry Behavior",   "Actor",       "W_W", -87.11,
  "Angry Behavior", "Partner",       "W_H", -76.18,
  "Angry Behavior", "Partner",       "H_W",  -91.8,
       "Disregard",   "Actor",       "H_H", -38.62,
       "Disregard",   "Actor",       "W_W", -47.54,
       "Disregard", "Partner",       "W_H", -82.81,
       "Disregard", "Partner",       "H_W", -79.36,
      "Distancing",   "Actor",       "H_H", -47.42,
      "Distancing",   "Actor",       "W_W",   3.04,
      "Distancing", "Partner",       "W_H",  -0.05,
      "Distancing", "Partner",       "H_W",  -53.5
  )

# Make Model
model <- d_coefficients |>
  mutate(b = b / 100) |>
  unite(Predictor, c(Group, Predictor)) |>
  mutate(across(c(Dependent, Predictor), snakecase::to_snake_case)) |>
  unite(b, c(b, Predictor), sep = " * ") |>
  summarise(b = paste(b, collapse = " + "), .by = Dependent) |>
  unite(Model, c(Dependent, b), sep = " ~ ") |>
  pull(Model)

# Make data
d_simulated <- lavaan::simulateData(model, sample.nobs = 50) |>
  as_tibble() |>
  mutate(id = row_number(), .before = 0) |>
  pivot_longer(angry_behavior:distancing,
               values_to = "y", names_to = "Dependent") |>
  mutate(y = y  * 100) |>
  nest(data = -Dependent)


# Analyze data
d_analysis <- d_simulated |>
  mutate(
    fit = map(data, \(d) {
      lm(y ~ ., data = d |> select(-id))
      }),
    tbl = map(fit, parameters::parameters))

# Format data
d_formatted <- d_analysis |>
  select(Dependent, tbl) |>
  unnest(tbl) |>
  apa_format_columns() |>
  filter(Variable != "Constant") |>
  separate(Variable, c("Type", "i", "d")) |>
  mutate(across(c(i,d), toupper)) |>
  unite(Variable, c(i, d), sep = c(" \u2192 ")) |>
  relocate(`95% CI`, .after = last_col()) |>
  as_grouped_data(groups = c("Dependent", "Type")) |>
  mutate(across(c(Type, Variable), \(x) tidyr::replace_na(x, ""))) |>
  mutate(Variable = paste0(Type, Variable, recycle0 = TRUE),
         Dependent = snakecase::to_sentence_case(Dependent)) |>
  fill(Dependent) |>
  filter(Variable != "") |>
  select(-Type)

# Make Table
d_formatted |>
  apa_flextable(row_title_column = Dependent,
                row_title_align = "center",
                line_spacing = 1.5,
                no_format_columns = Variable) |>
  padding(j = 1,
          i = ~`*B*` != "",
          padding.left = 20) |>
  width(width = c(1.1, rep(.85, 4), 2))
```
Variable | B | SE | t | p | 95% CI |
|---|---|---|---|---|---|
Angry behavior | |||||
Actor | |||||
H → H | −88.77 | 14.91 | −5.96 | <.001 | [−118.79, −58.75] |
W → W | −83.72 | 13.84 | −6.05 | <.001 | [−111.60, −55.84] |
Partner | |||||
W → H | −70.92 | 17.41 | −4.07 | <.001 | [−105.98, −35.86] |
H → W | −74.38 | 16.11 | −4.62 | <.001 | [−106.83, −41.93] |
Disregard | |||||
Actor | |||||
H → H | −33.51 | 14.08 | −2.38 | .02 | [ −61.87, −5.15] |
W → W | −65.67 | 13.07 | −5.02 | <.001 | [ −92.00, −39.34] |
Partner | |||||
W → H | −78.89 | 16.44 | −4.80 | <.001 | [−112.01, −45.77] |
H → W | −83.30 | 15.22 | −5.47 | <.001 | [−113.95, −52.65] |
Distancing | |||||
Actor | |||||
H → H | −31.47 | 14.10 | −2.23 | .03 | [ −59.86, −3.08] |
W → W | 9.47 | 13.09 | 0.72 | .47 | [ −16.90, 35.83] |
Partner | |||||
W → H | −14.79 | 16.47 | −0.90 | .37 | [ −47.95, 18.37] |
H → W | −73.34 | 15.24 | −4.81 | <.001 | [−104.03, −42.65] |
Table 1
Regressions of Associations Between Marital Satisfaction and Average Levels of Marital Behavior
Note. CI = confidence interval; H → H = husband-as-actor effect on the husband’s own marital satisfaction; W → W = wife-as-actor effect on the wife’s own marital satisfaction; W → H = wife-as-partner effect on the husband’s satisfaction; H → W = husband-as-partner effect on the wife’s satisfaction.
Citation
BibTeX citation:
@misc{schneider2025,
  author = {Schneider, W. Joel},
  title = {Recreating {APA} {Manual} {Table} 7.16 in {R} with Apa7},
  date = {2025-09-26},
  url = {https://wjschne.github.io/posts/apatables/apa716.html},
  langid = {en}
}
For attribution, please cite this work as:
Schneider, W. J. (2025, September 26). Recreating APA Manual Table 7.16
in R with apa7. Schneirographs. https://wjschne.github.io/posts/apatables/apa716.html