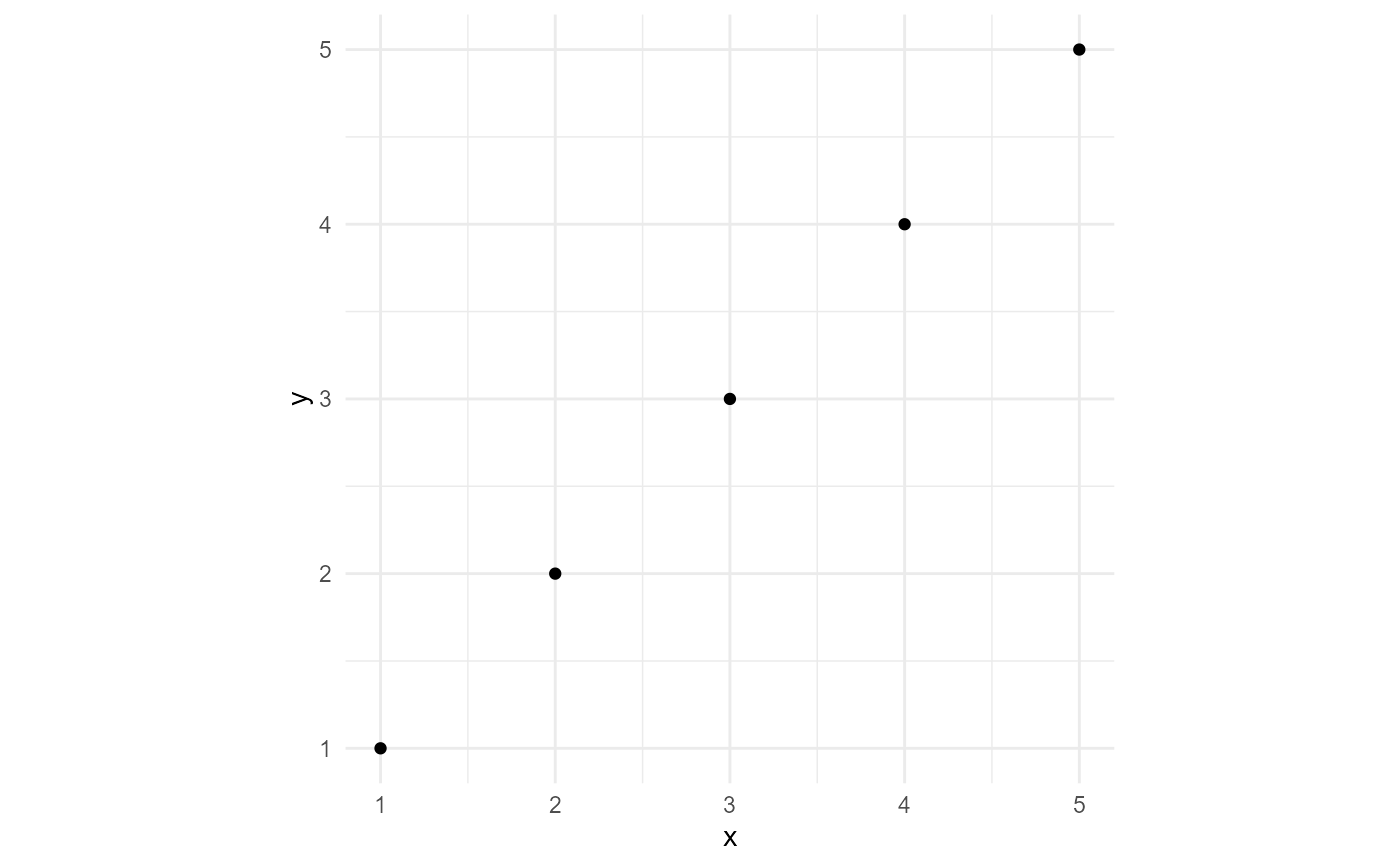
Points are specified with x and y coordinates.
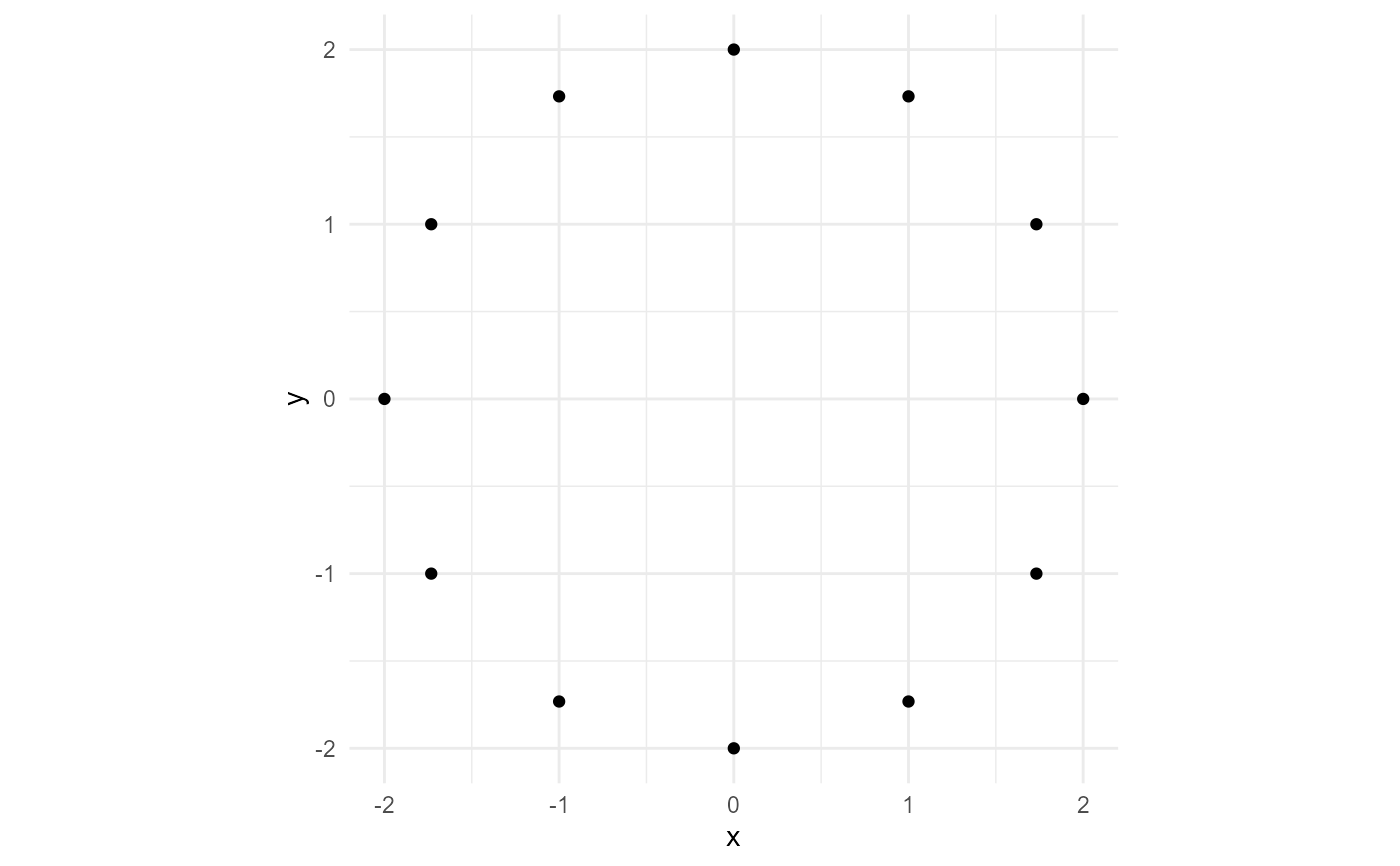
Polar points are ordinary points but are specified with an angle (theta) and a radial distance (r)
Usage
ob_point(
  x = 0,
  y = 0,
  alpha = numeric(0),
  color = character(0),
  fill = character(0),
  shape = numeric(0),
  size = numeric(0),
  stroke = numeric(0),
  style = S7::class_missing,
  id = character(0),
  ...
)

ob_polar(
  theta = S7::class_missing,
  r = numeric(0),
  alpha = numeric(0),
  color = character(0),
  fill = character(0),
  shape = numeric(0),
  size = numeric(0),
  stroke = numeric(0),
  style = S7::class_missing,
  id = character(0)
)
Arguments
- x
Vector of coordinates on the x-axis (also can take a tibble/data.frame or 2-column matrix as input.)
- y
Vector of coordinates on the y-axis
- alpha
numeric value for alpha transparency
- color
character string for color
- fill
character string for fill color
- shape
Point shape type. Can be specified with an integer (between 0 and 25), a single character (which uses that character as the plotting symbol), a . to draw the smallest rectangle that is visible (i.e., about one pixel), an NA to draw nothing, or a mapping to a discrete variable.
- size
numeric size
- stroke
Width of point border line
- style
Gets and sets the styles associated with points
- id
character string to identify object
- ...
<
dynamic-dots> properties passed tostyle- theta
Angle of the vector from the origin to the
ob_point- r
Radius = Distance from the origin to the ob_point
Slots
auto_labelGets x and y coordinates and makes a label
"(x,y)"geomA function that converts the object to a geom. Any additional parameters are passed to
ggplot2::geom_point.lengthThe number of points in the ob_point object
tibbleGets a
tibble::tibblecontaining parameters and styles used byggplot2::geom_point.xyGets a 2-column matrix of the x and y coordinates of the ob_point object.
centroidob_point at the average of the x and y values
bounding_boxob_rectangle that contains all the points in the object
placefunction to place point in relation to other objects
labelfunction to create ob_label for points in the object
aestheticsreturns class_aesthetics for ob_point
Examples
ggdiagram() +
  ob_point(1:5, 1:5) +
  ggplot2::theme_minimal()


ggdiagram() +
  ob_polar(degree(seq(0, 330, 30)), r = 2) +
  ggplot2::theme_minimal()

