Setup
Packages
Base Plot
To avoid repetitive code, we make a base plot:
my_font <- "Roboto Condensed"
my_font_size <- 20
my_point_size <- 2


# my_colors <- viridis::viridis(2, begin = .25, end = .5)
my_colors <- c("#3B528B", "#21908C")

theme_set(
  theme_minimal(
    base_size = my_font_size,
    base_family = my_font) +
    theme(axis.title.y = element_text(angle = 0, vjust = 0.5)))

bp <- ggdiagram(
  font_family = my_font,
  font_size = my_font_size,
  point_size = my_point_size,
  linewidth = .5,
  theme_function = theme_minimal,
  axis.title.x =  element_text(face = "italic"),
  axis.title.y = element_text(
    face = "italic",
    angle = 0,
    hjust = .5,
    vjust = .5)) +
  scale_x_continuous(labels = signs_centered,
                     limits = c(-4, 4)) +
  scale_y_continuous(labels = signs::signs,
                     limits = c(-4, 4))
Paths
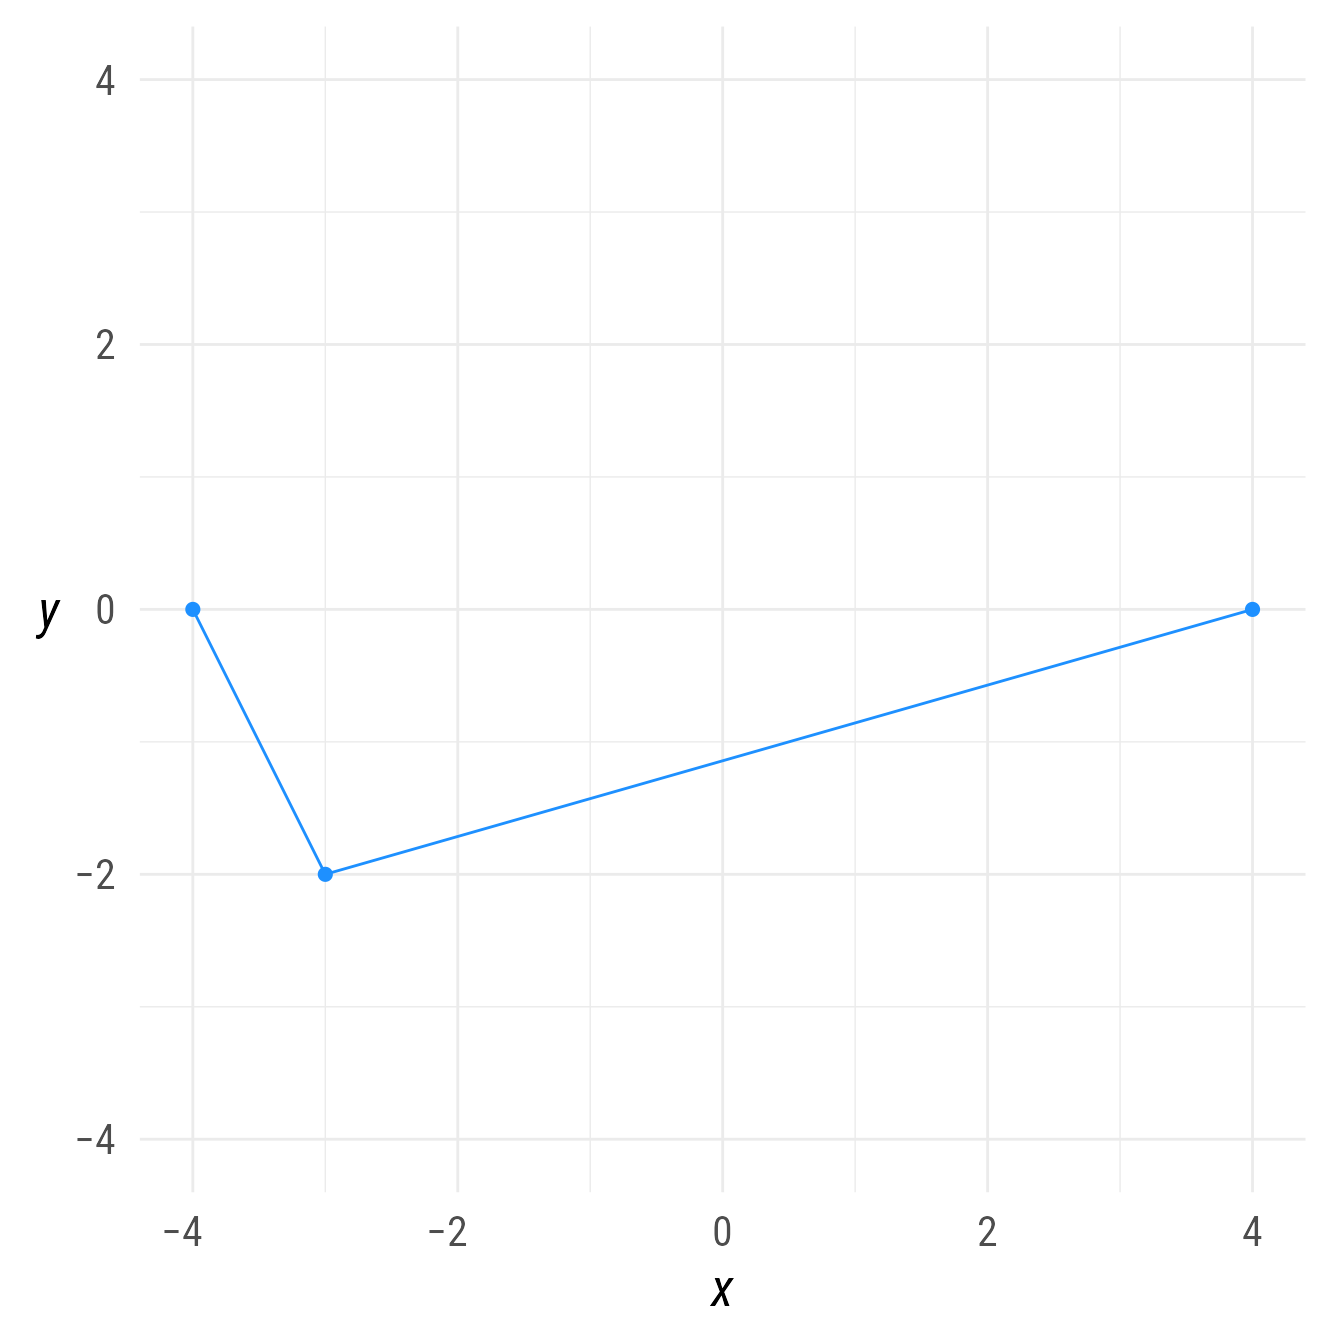
The path function creates an object that connects points along a path.
Path Labels
The label of a path is created with geomtextpath::geom_labelpath, and thus will curve if the path is curved.
p_curve <- tibble(x = seq(-4, 4, .1),
                  y = (pnorm(x) * 8 - 4)) |>
  ob_point()


bp +
  ob_path(
    p = p_curve,
    label = ob_label(
      "A path label will curve along the path.",
      vjust = -.1,
      size = 20,
      color = "dodgerblue4"
    ),
    arrowhead_length = 8,
    arrow_head = arrowhead()
  )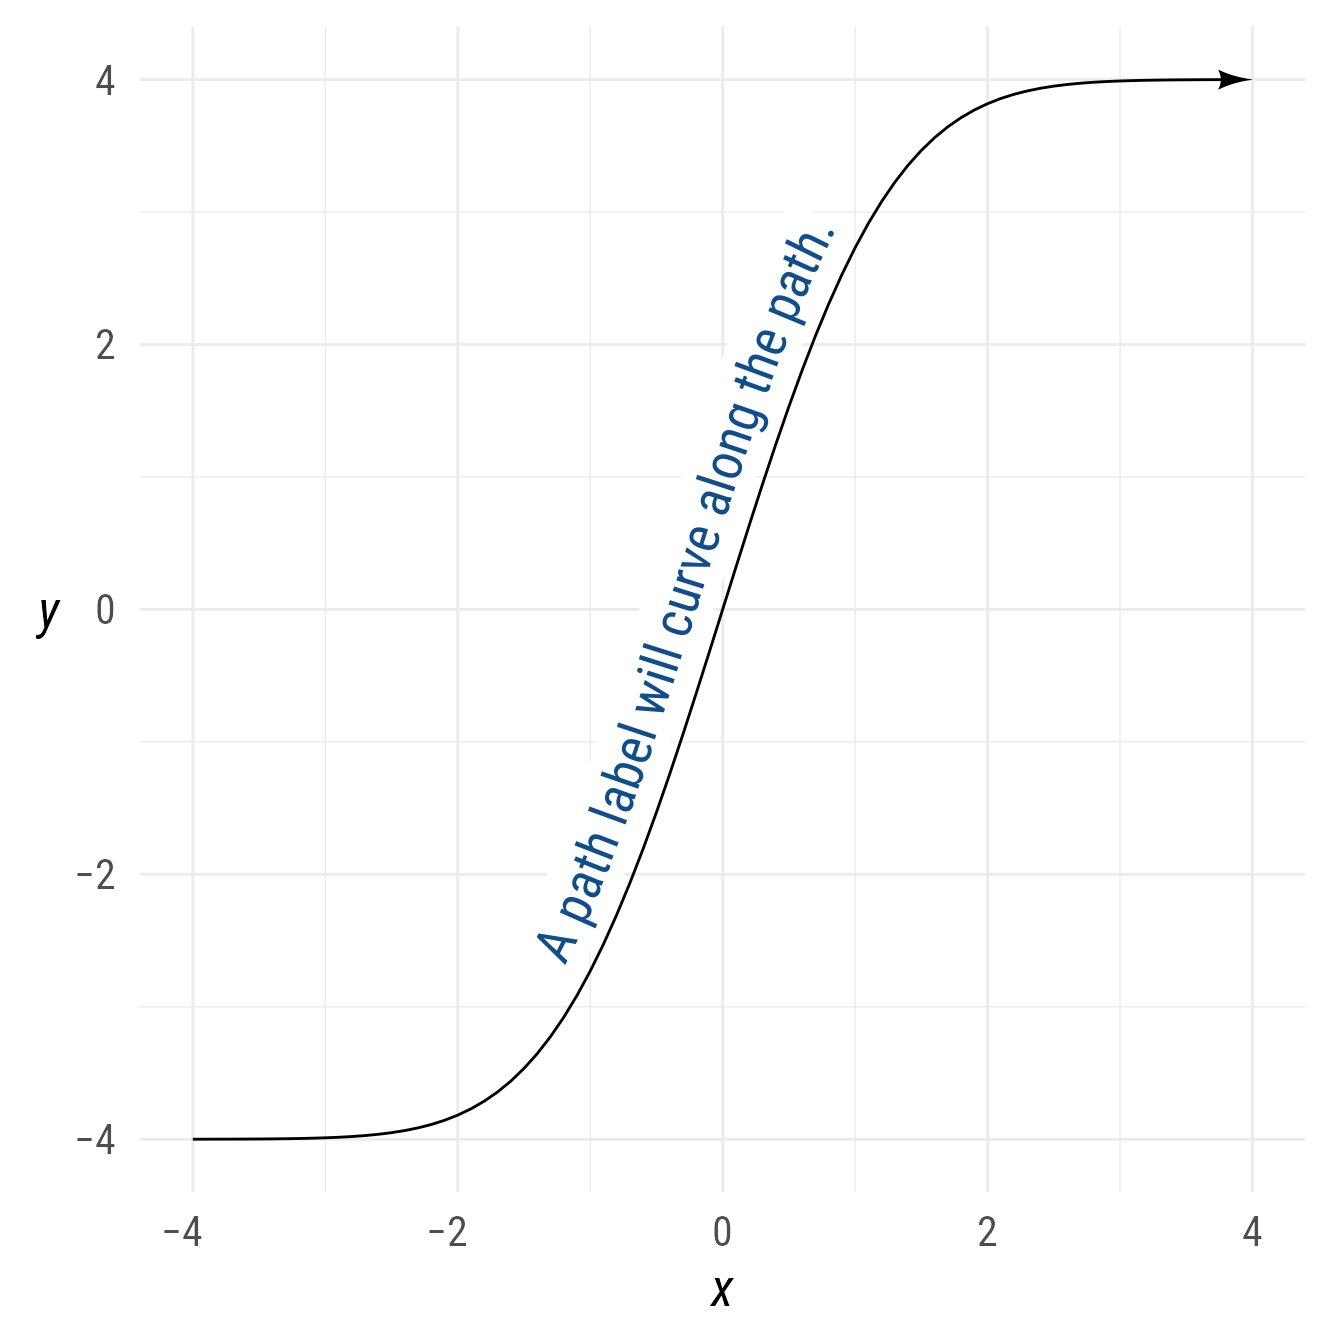
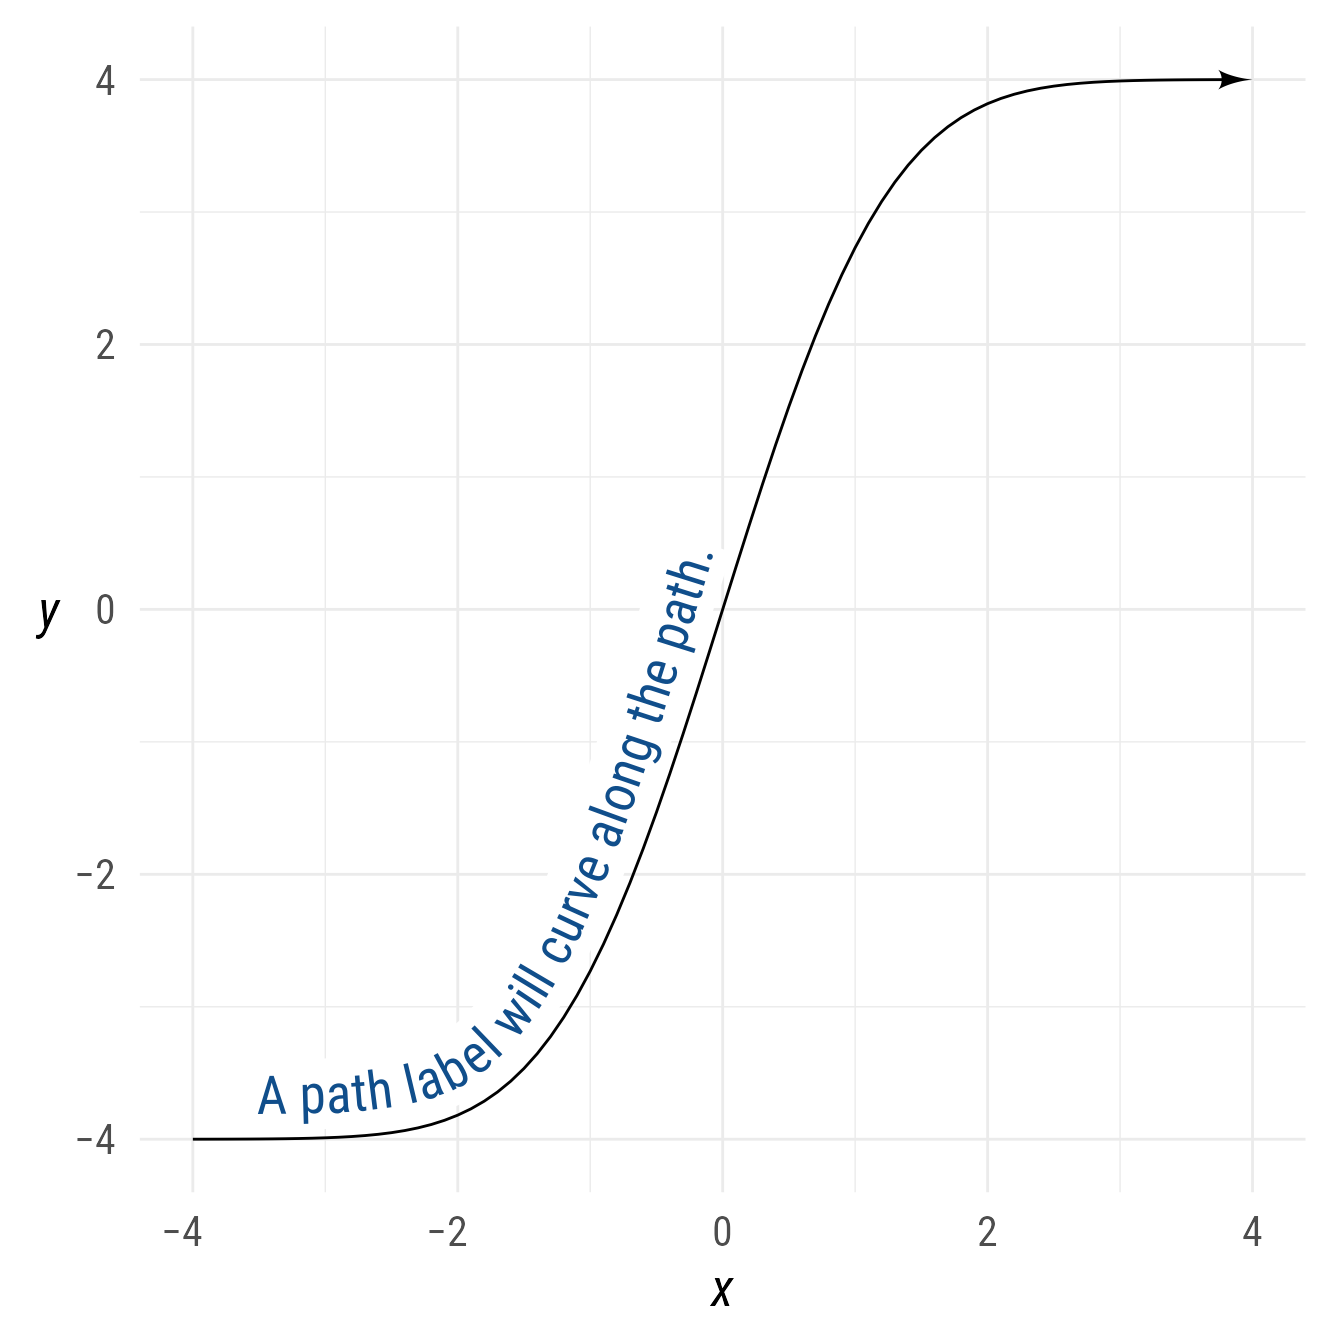
You can control the position of the path label with either the label’s position or hjust properties.
Multiple paths
To create multiple paths at once, specify a list or vector of point objects.
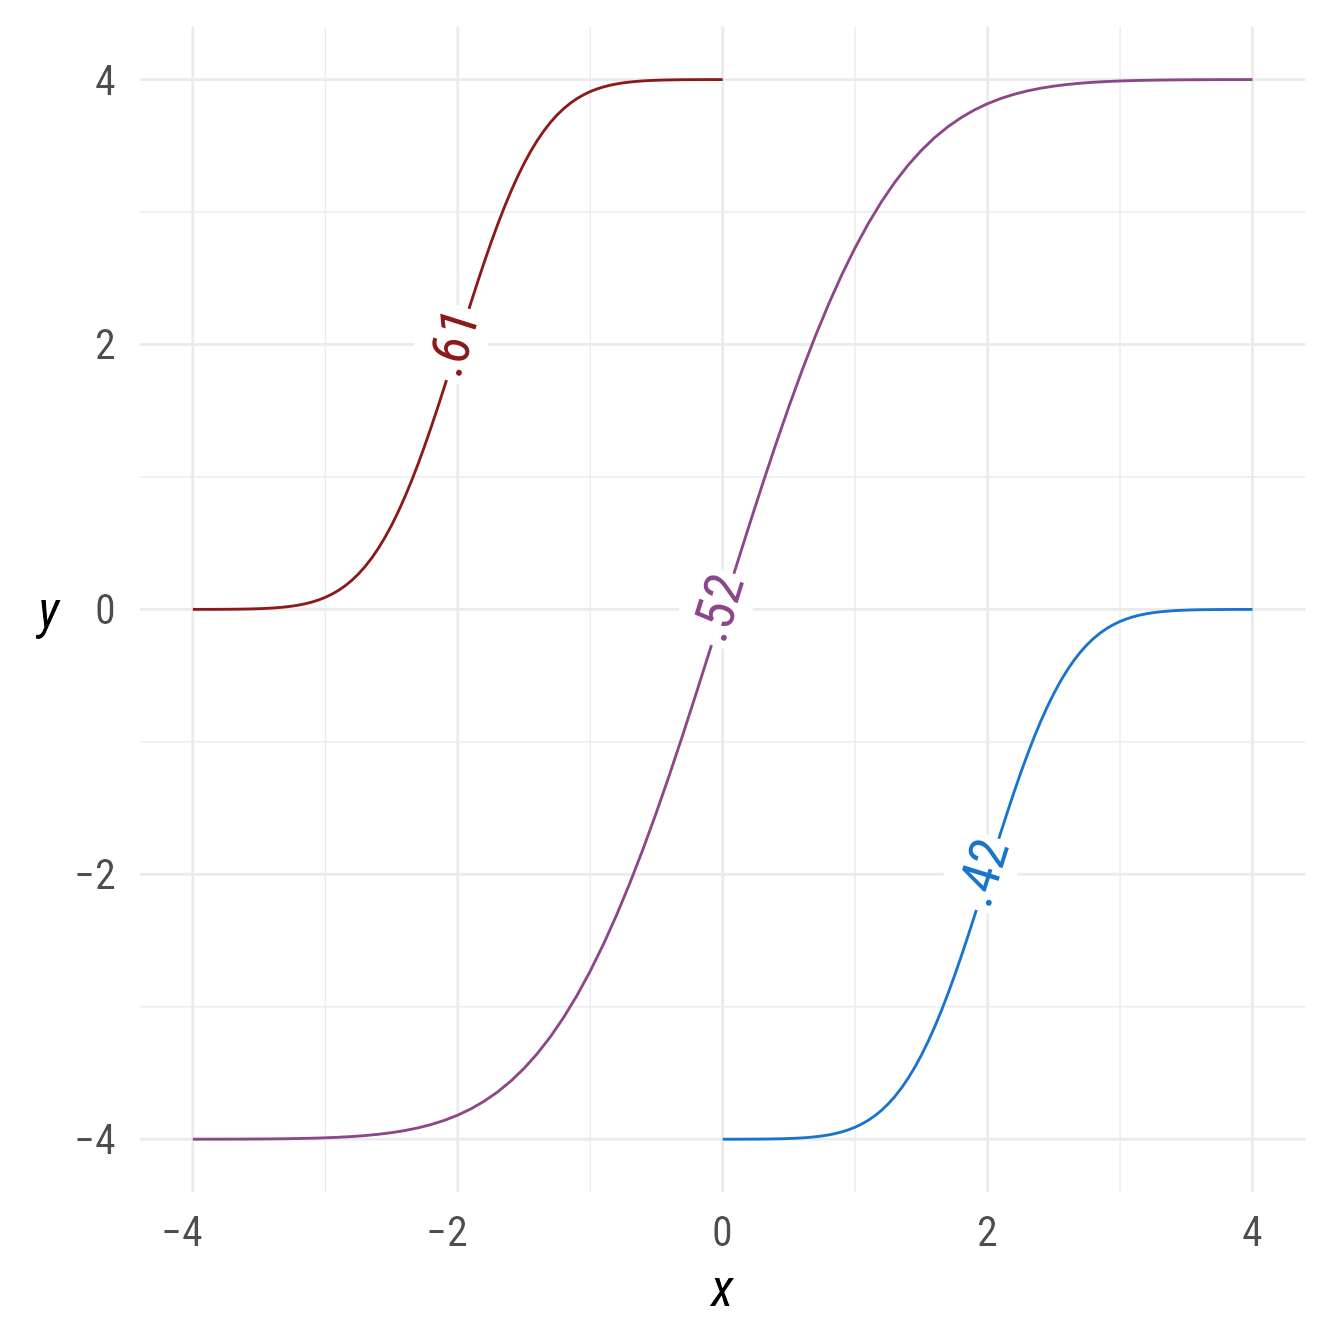
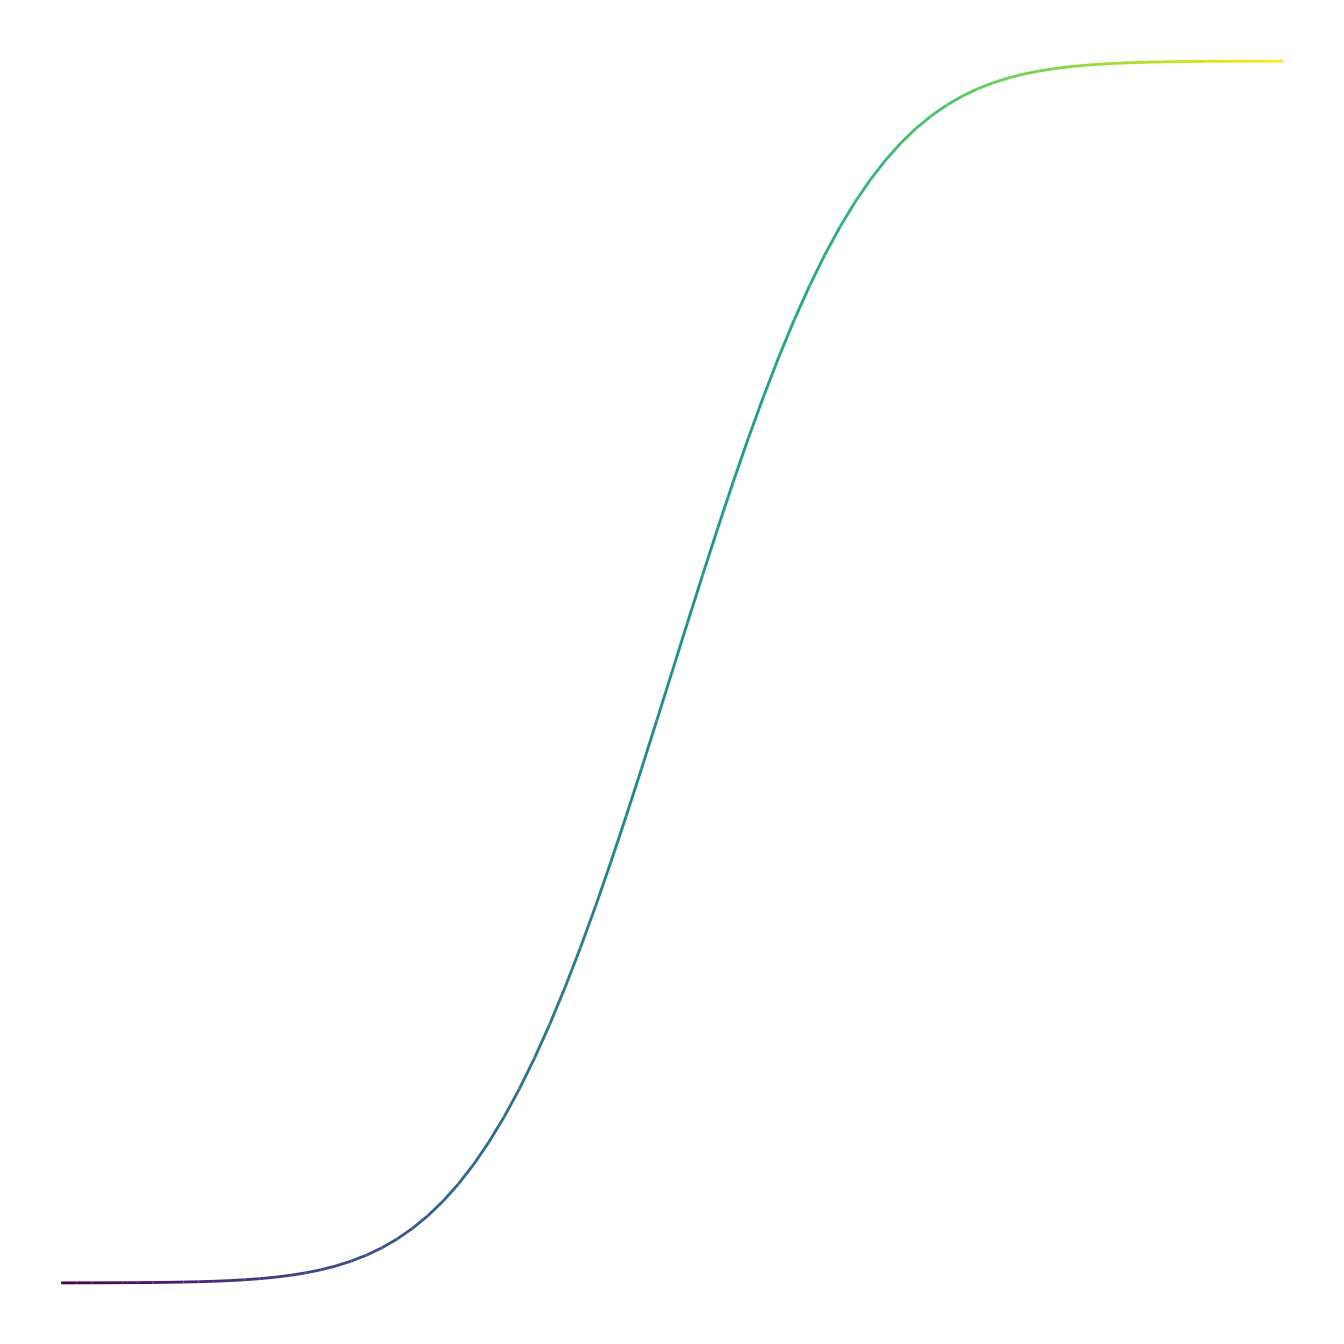
Segments
It is possible to create color gradients along a path using the paths’ segments.