Setup
Packages
Base Plot
To avoid repetitive code, we make a base plot:
my_font <- "Roboto Condensed"
my_font_size <- 20
my_point_size <- 2

# my_colors <- viridis::viridis(2, begin = .25, end = .5)
my_colors <- c("#3B528B", "#21908C")

theme_set(
  theme_minimal(
    base_size = my_font_size,
    base_family = my_font) +
    theme(axis.title.y = element_text(angle = 0, vjust = 0.5)))

bp <- ggdiagram(
  font_family = my_font,
  font_size = my_font_size,
  point_size = my_point_size,
  linewidth = .5,
  theme_function = theme_minimal,
  axis.title.x =  element_text(face = "italic"),
  axis.title.y = element_text(
    face = "italic",
    angle = 0,
    hjust = .5,
    vjust = .5)) +
  scale_x_continuous(labels = signs_centered,
                     limits = c(-4, 4)) +
  scale_y_continuous(labels = signs::signs,
                     limits = c(-4, 4))
Polygons
The ob_polygon function creates an object that connects points to make a polygon.
p <- ob_point(
  x = c(-4, -3, 4, 3, -1),
  y = c(0, 4, 3, -3, -4))

bp +
  ob_polygon(p, fill = "dodgerblue3")
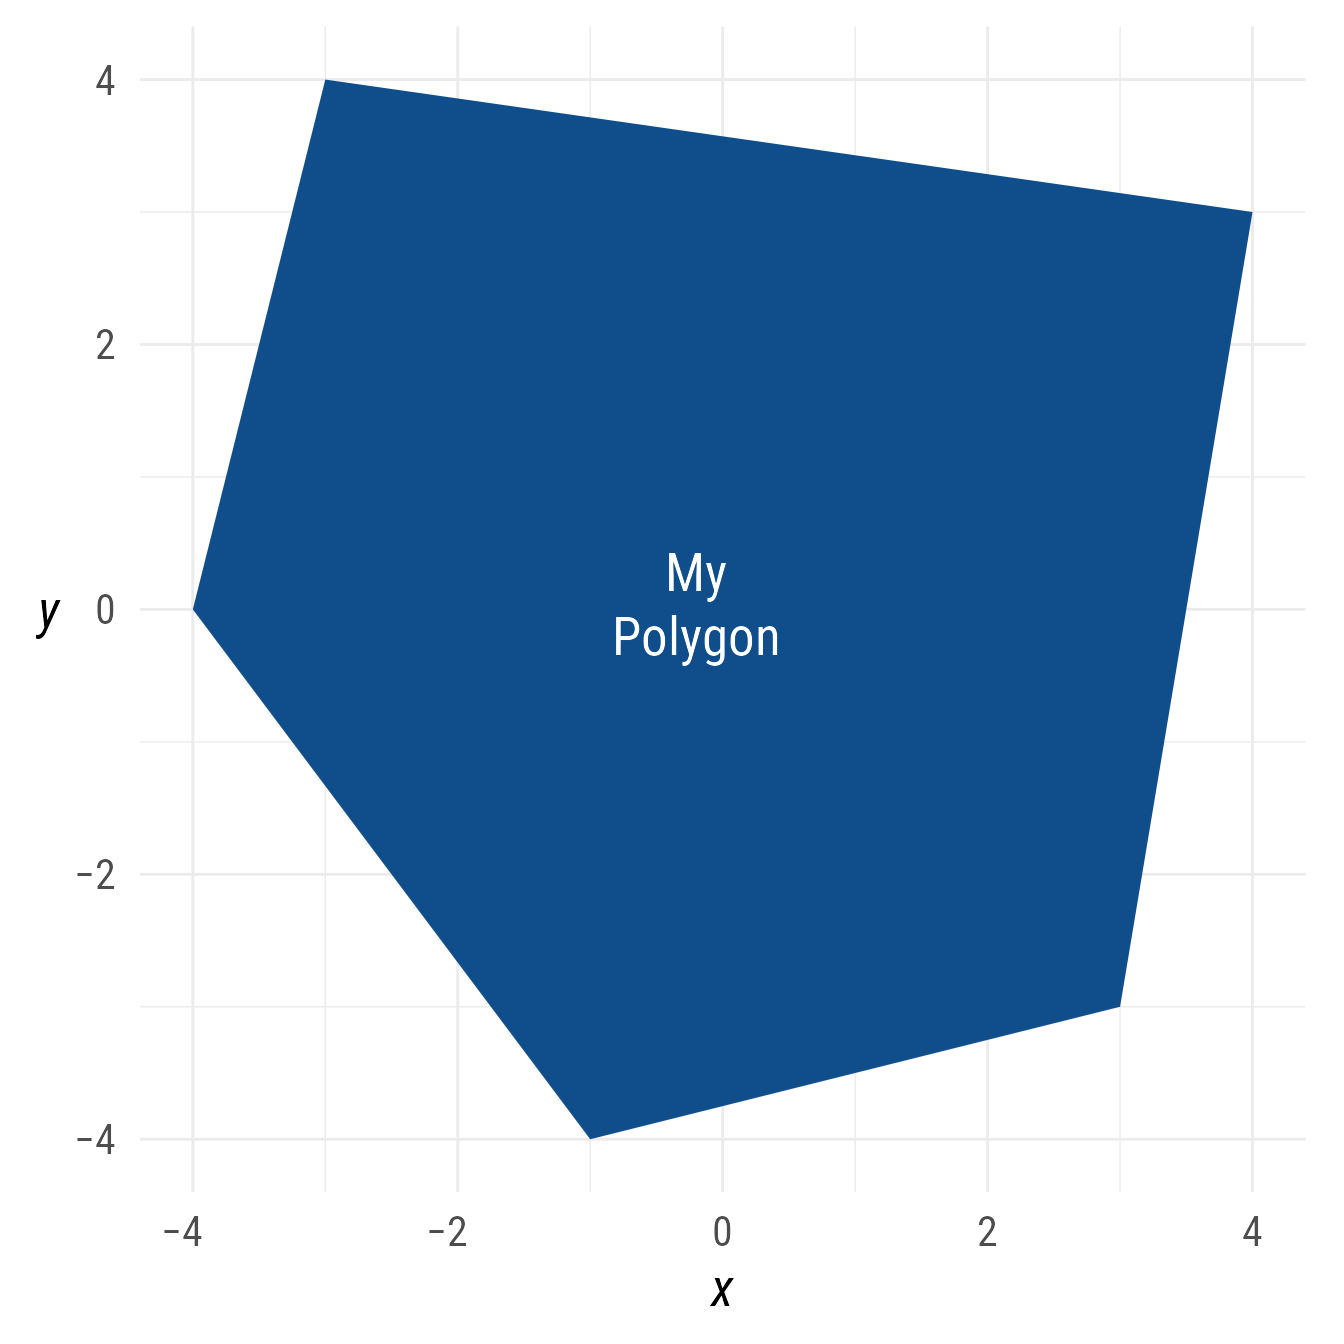
Polygon Labels
The label of a ob_polygon object is placed, by default, at the centroid of the polygon. The centroid is the point whose x coordinate is the average of all the x coordinates of the polygon’s points and whose y coordinate is likewise the average of all the point’s y coordinates.
bp +
  ob_polygon(
    p = p,
    label = ob_label(
      "My<br>Polygon",
      size = 20,
      color = "white"
    ),
    fill = "dodgerblue4"
  )
Connecting polygons
Connections between polygons are arrows that emanate from and point towards the polygons’ centroids.
bp +
  {p1 <- ob_polygon(.5 * p - ob_point(1.9, 1.9),
                    fill = "dodgerblue4")} +
  {p2 <- ob_polygon(.5 * p + ob_point(1.9, 1.9),
                    fill = "orchid4")} +
  connect(p1, p2,
          resect = 1,
          label = ".45")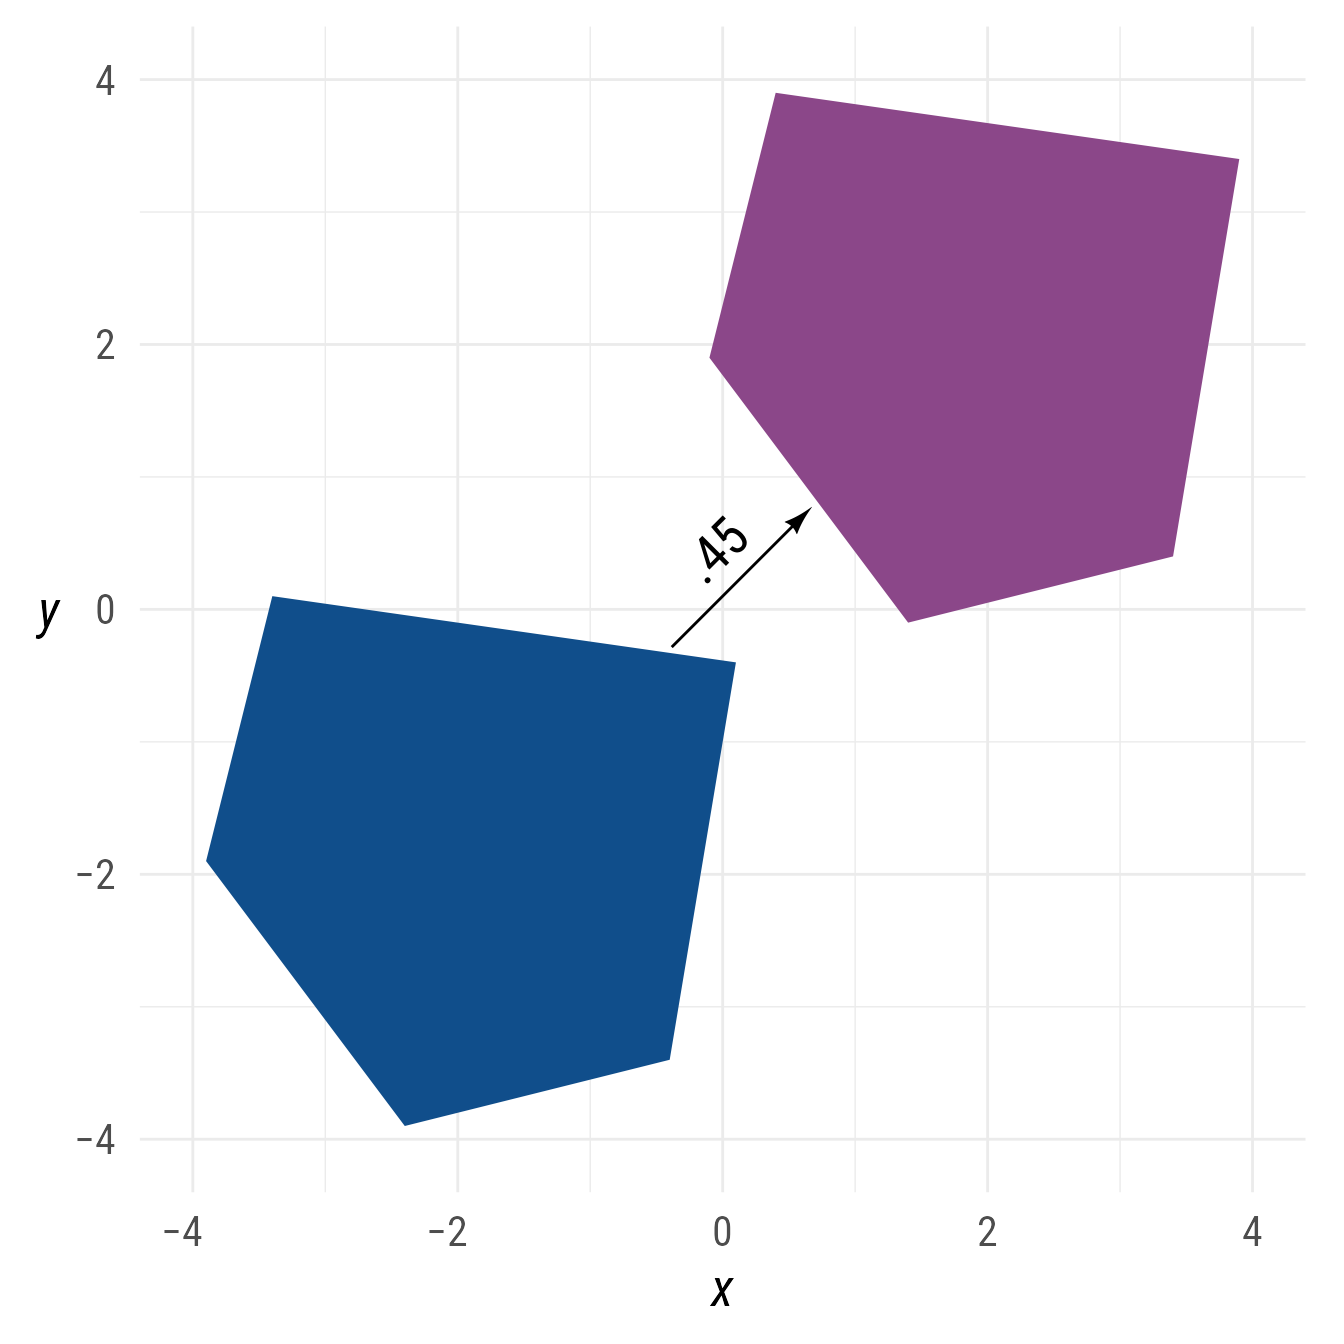
Rounding polygons
The @radius property controls the radius of the rounded vertices. It must be of length 1. It can be given in as a ggplot2::unit or as a numeric value. If numeric, it is understood as a proportion of the plot area width.
bp +
  ob_polygon(
    p,
    radius = unit(5, "mm"),
    fill = "dodgerblue4")
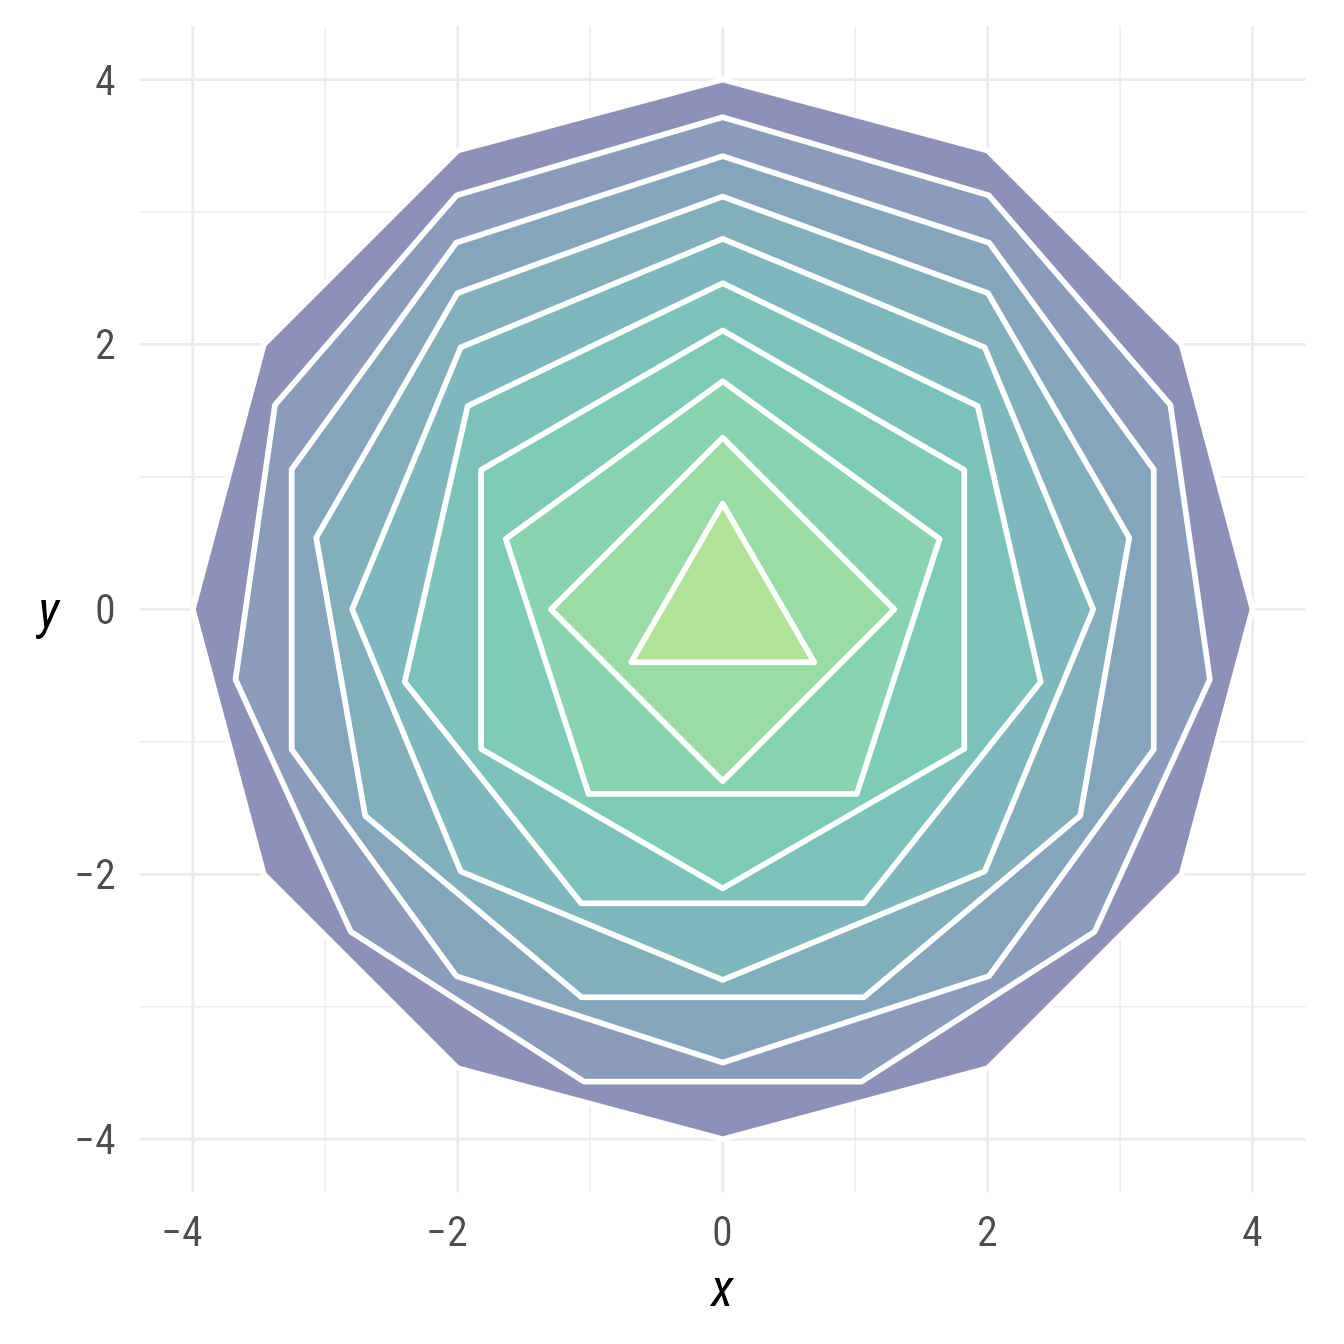
Regular Polygons (ngons)
An ob_ngon (regular polygon) can be be created by specifying the center point, the number of sides, and the radius (the distance from the center to a vertex).
In Figure 5, many regular polygons are displayed concentrically.
n <- 10
bp +
  ob_ngon(
    n = n:1 + 2,
    radius = 4 * seq(1, .1, length.out = n) ^ .7,
    fill = viridis::viridis(n = n, begin = .2, end = .8) %>%
      tinter::lighten(.6),
    color = "white",
    linewidth = 1,
    angle = 90
  )
Alternately, instead of the radius, the ob_ngon object can be specified with either the side_length or the apothem (the distance from the center to a side’s midpoint).
bp +
  {ng <- ob_ngon(n = 8,
                 radius = 4,
                 angle = degree(22.5),
                 fill = "dodgerblue4")} +
  ob_segment(
    ng@center,
    ng@vertices[1],
    color = "white",
    label = ob_label(
      paste0("Radius = ", ng@radius),
      vjust = 1.2,
      fill = NA,
      family = my_font
    )
  ) +
  ob_segment(
    ng@center,
    ng@segment[1]@midpoint(),
    color = "white",
    label = ob_label(
      paste0("Apothem = ", round(ng@apothem, 2)),
      vjust = -.2,
      fill = NA,
      family = my_font
    )
  ) +
  ob_label(paste0("Side = ",
                  round(ng@side_length, 2)),
           ng@segment[1]@midpoint(),
           angle = ng@segment[1]@line@angle,
           vjust = -0.2,
           family = my_font)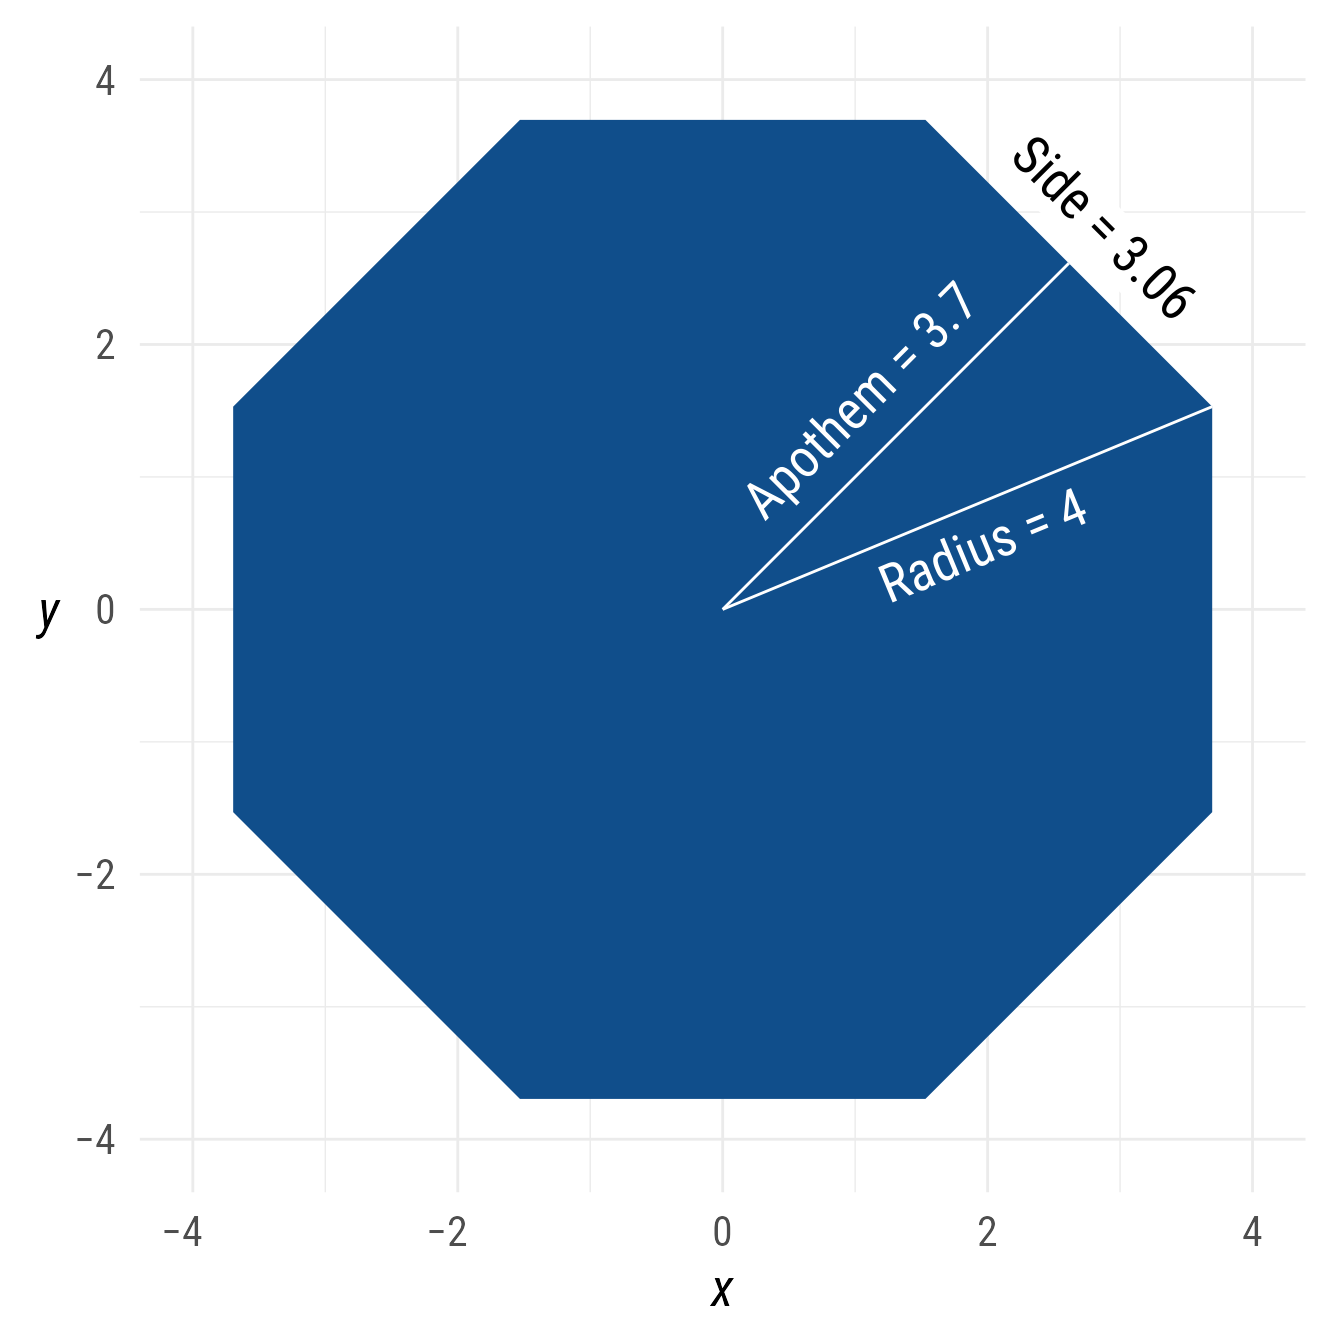
ob_ngon object can be specificied with the radius, side_length, or apothem.
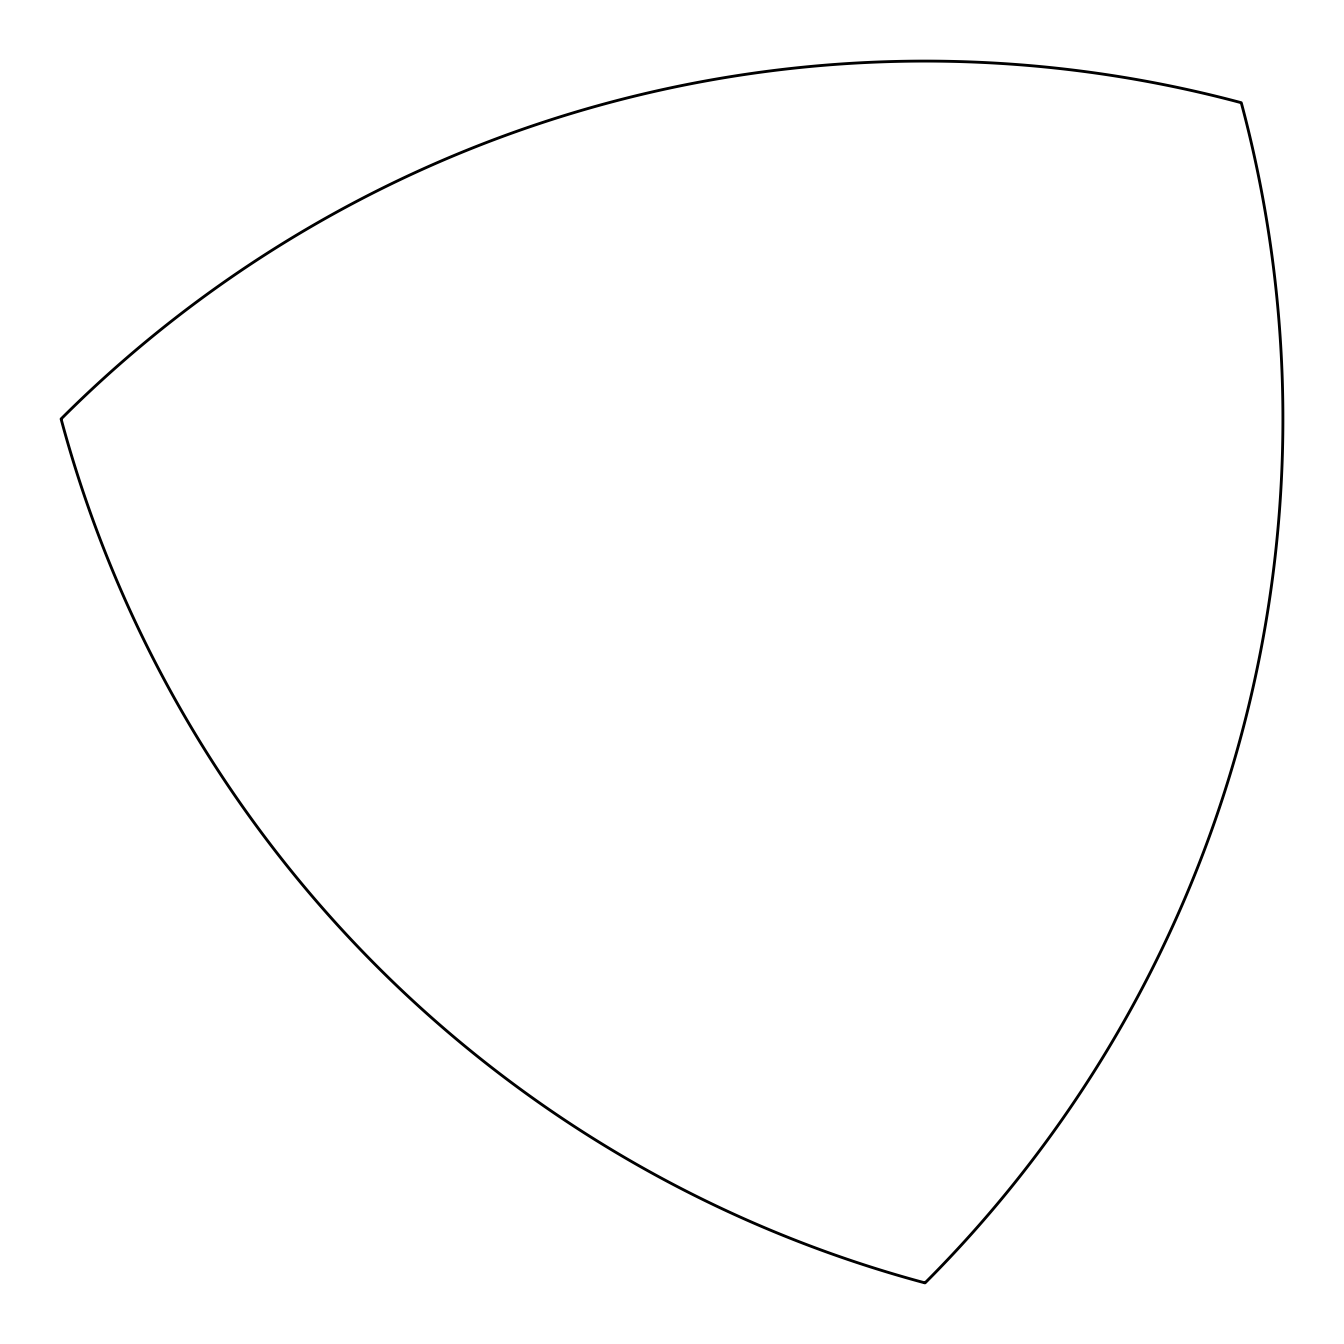
Reuleaux Polygons
Start with a regular polygon with an odd number of sides. For each pair of adjacent vertices, draw an arc with its center on the vertex of the opposite side. Amazingly, if you roll a Reuleaux polygon, its height is constant. This means that a Reuleaux polygon can roll smoothly. In Figure 7, a Reuleaux triangle is made with the ob_reuleaux function.
th <- 275
ggdiagram() +
  {x <- ob_reuleaux(
    n = 3,
    fill = NA,
    angle = 45
  )}
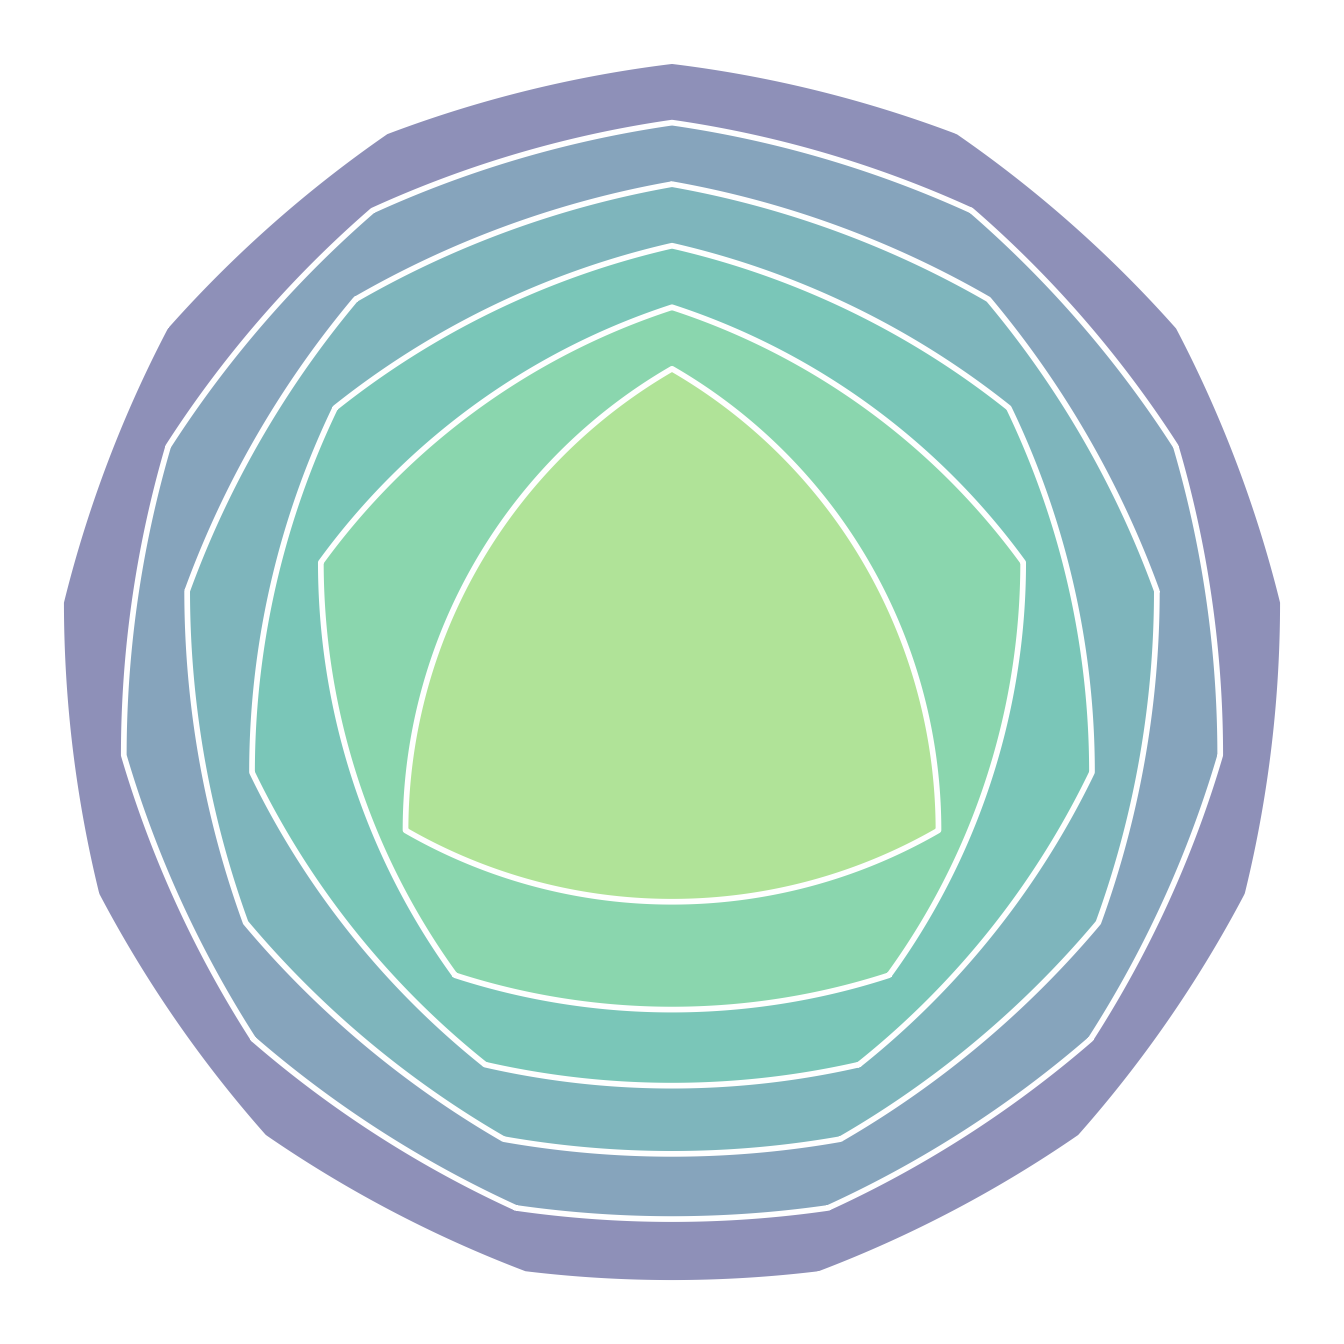
In Figure 8 we draw 6 Reuleaux polygons with sides ranging from 3 to 13.
ggdiagram() +
  ob_reuleaux(
    n = seq(13, 3, -2),
    radius = seq(2, 1, -.2),
    fill = viridis::viridis(
      n = 6,
      begin = .2,
      end = .8) %>%
      tinter::lighten(.6),
    color = "white",
    linewidth = 1
  )
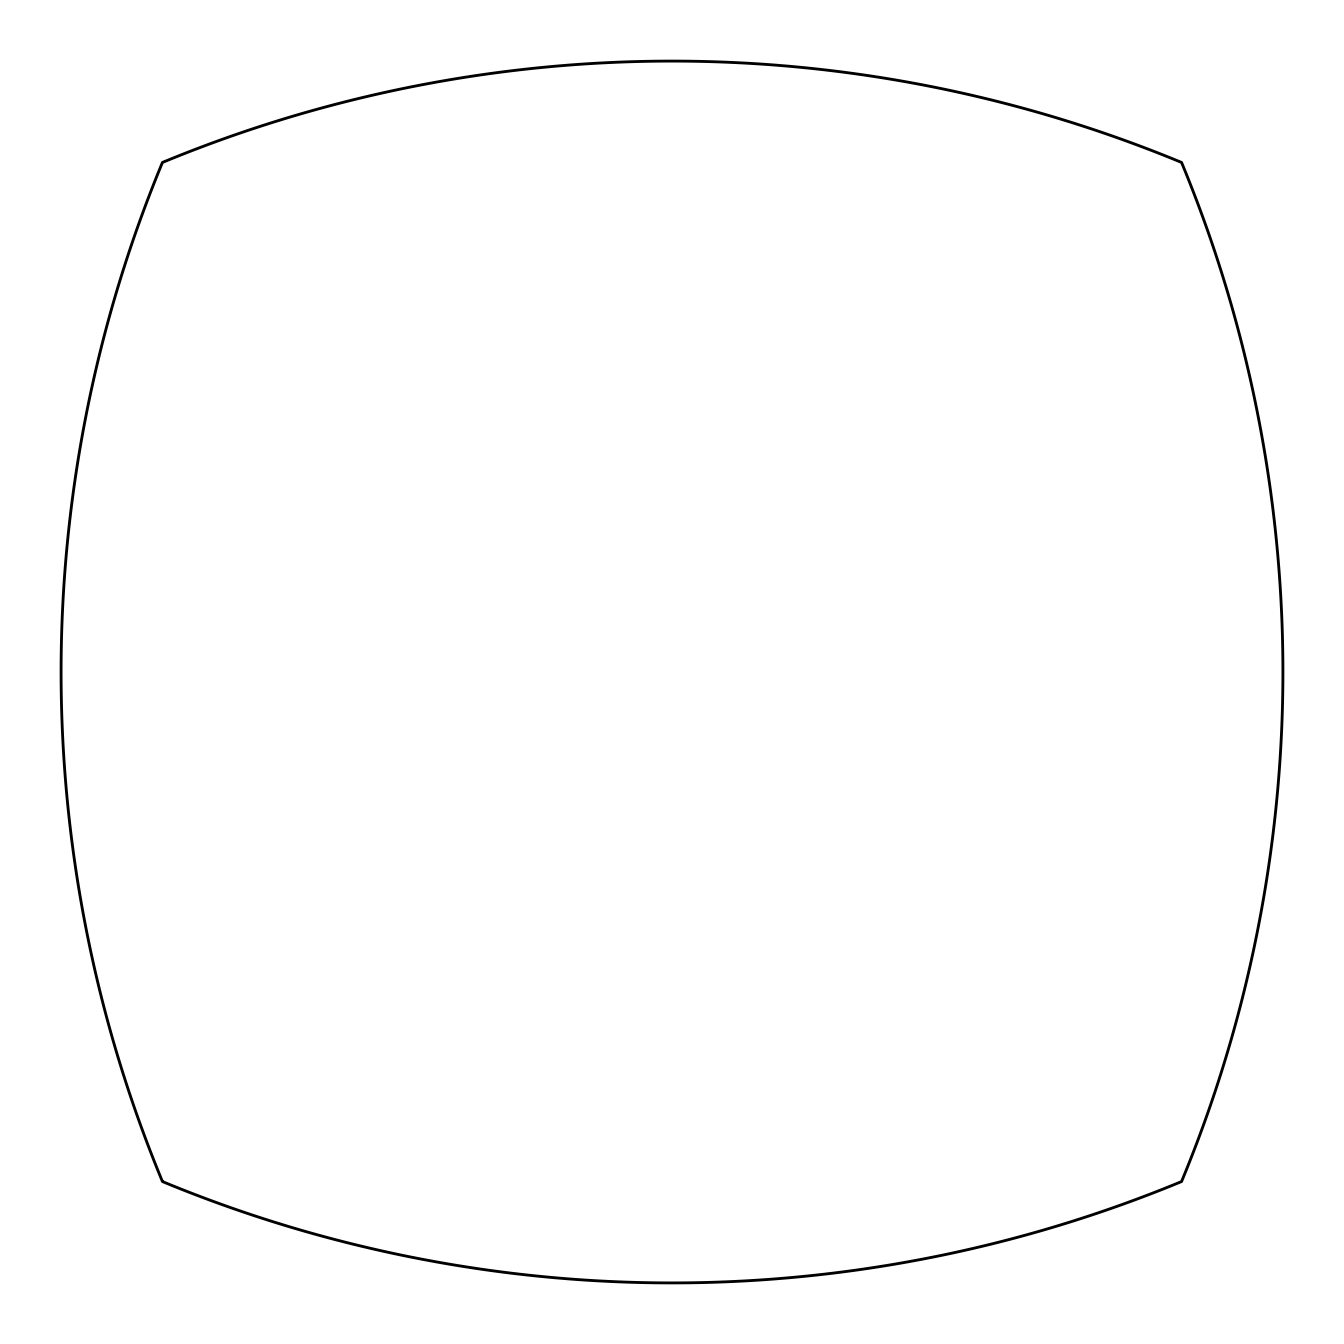
A true Reuleaux polygon with an even number of sides is not possible, but it is possible to draw even-sided figures that resemble Reuleaux polygons (Figure 9). These figures do not have same height as they roll.
ggdiagram() +
  ob_reuleaux(
    n = 4,
    fill = NA,
    angle = 45
  )
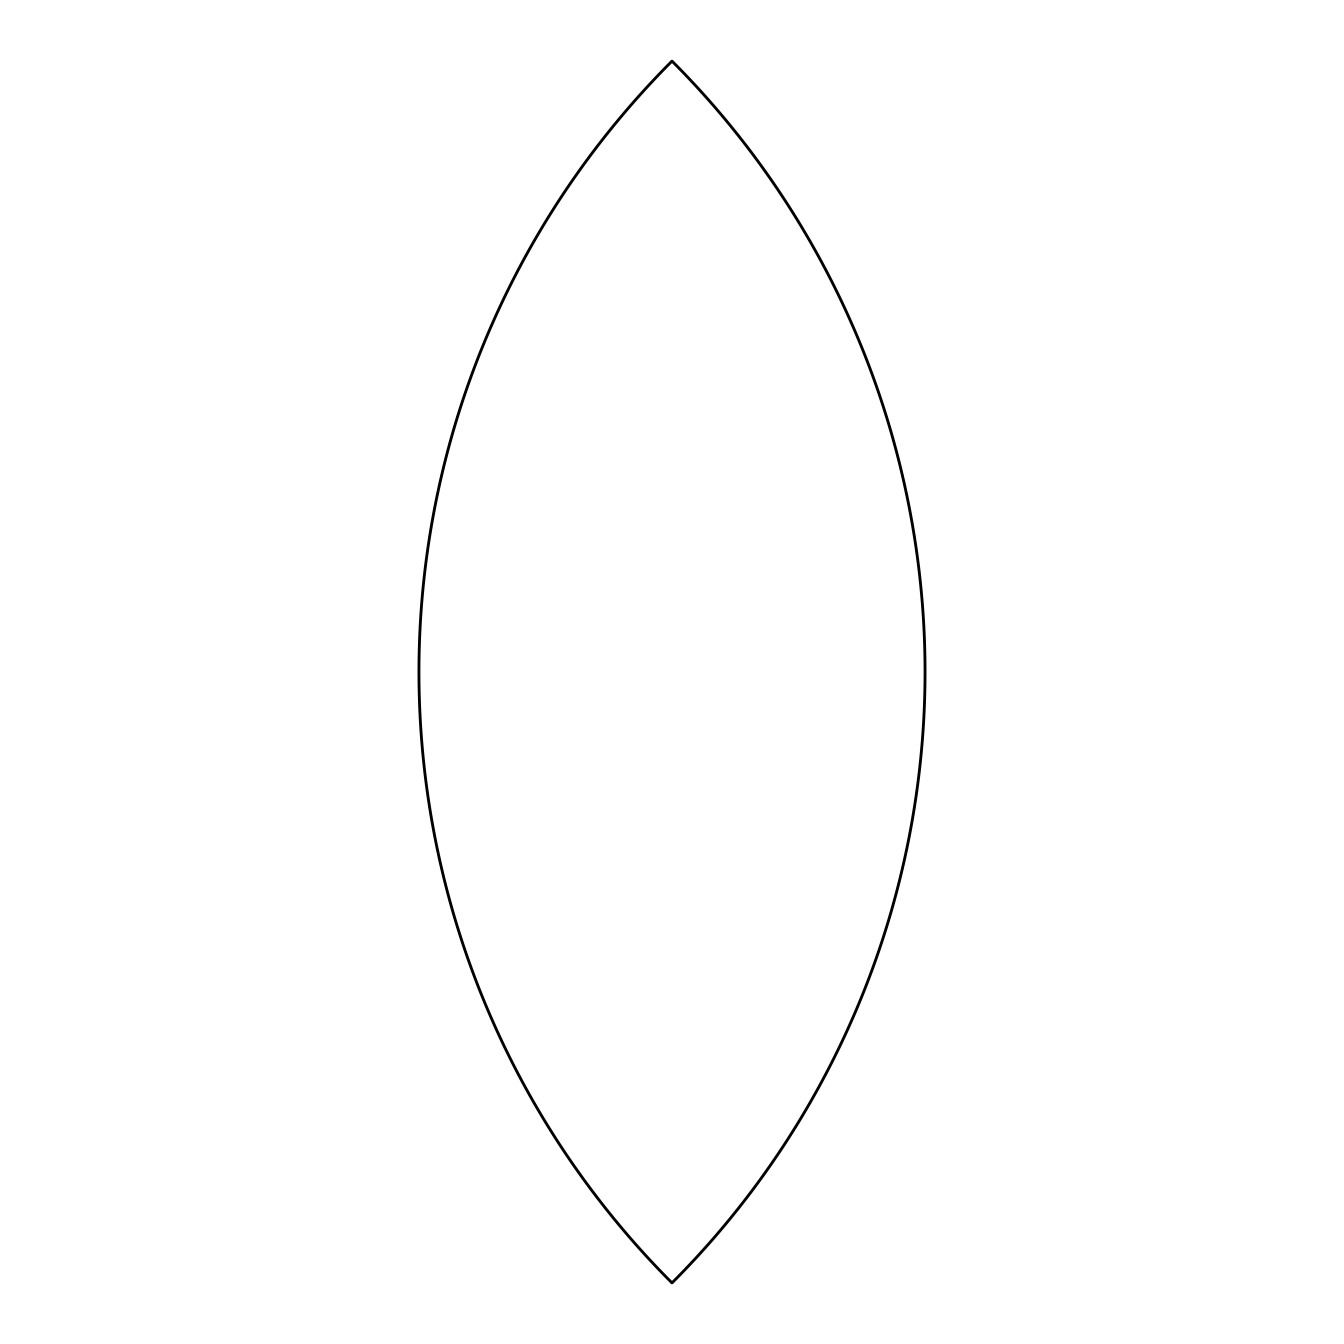
Specifying n = 2 will create a symmetric lens, which is also not a Reuleaux polygon.
ggdiagram() +
  ob_reuleaux(
    n = 2,
    fill = NA
  )