Skip to contents

Recreating Figures form Byrne’s Elements of Euclid

As an exercise, I wanted to see how well ggdiagram could recreate (loosely) a selection of the classic diagrams from Oliver Byrne’s (1847) Elements of Euclid. A beautiful, full reproduction can be seen here.

The code I have written is not always the cleanest, easiest way to do things. Instead of finding the quickest way to create the figures, I imagined that I have Euclidean construction tools only: a compass and a straightedge, and I produced the points, lines and circles in the same way they are specified in the text.

From Common_straightedge-and-compass_constructions, the allowable operations are:

  • Creating the line through two points
  • Creating the circle that contains one point and has a center at another point
  • Creating the point at the intersection of two (non-parallel) lines
  • Creating the one point or two points in the intersection of a line and a circle (if they intersect)
  • Creating the one point or two points in the intersection of two circles (if they intersect).
Code
library(ggdiagram)
library(ggplot2)
red <- "#d42a20"
yellow <- "#FAC22B"
blue <- "#0C7AA5"
black <- "#000000"
bg <- "#fcf3d9"
my_font <- "Libre Caslon Text"
knitr::opts_chunk$set(
  collapse = TRUE,
  dev = "ragg_png",
  dev.args = list(background = bg),
  comment = "#>",
  fig.width = 7,
  fig.height = 7
)

ggplot2::update_geom_defaults(ggforce::GeomCircle, list(linewidth = 2))
baseplot <- ggdiagram(
  panel.background = element_rect(bg, color = NA),
  plot.background = element_rect(bg, 
                                 color = NA),
  font_family = my_font, 
  linewidth = 2, font_size = 18)

Book I

Definition IX

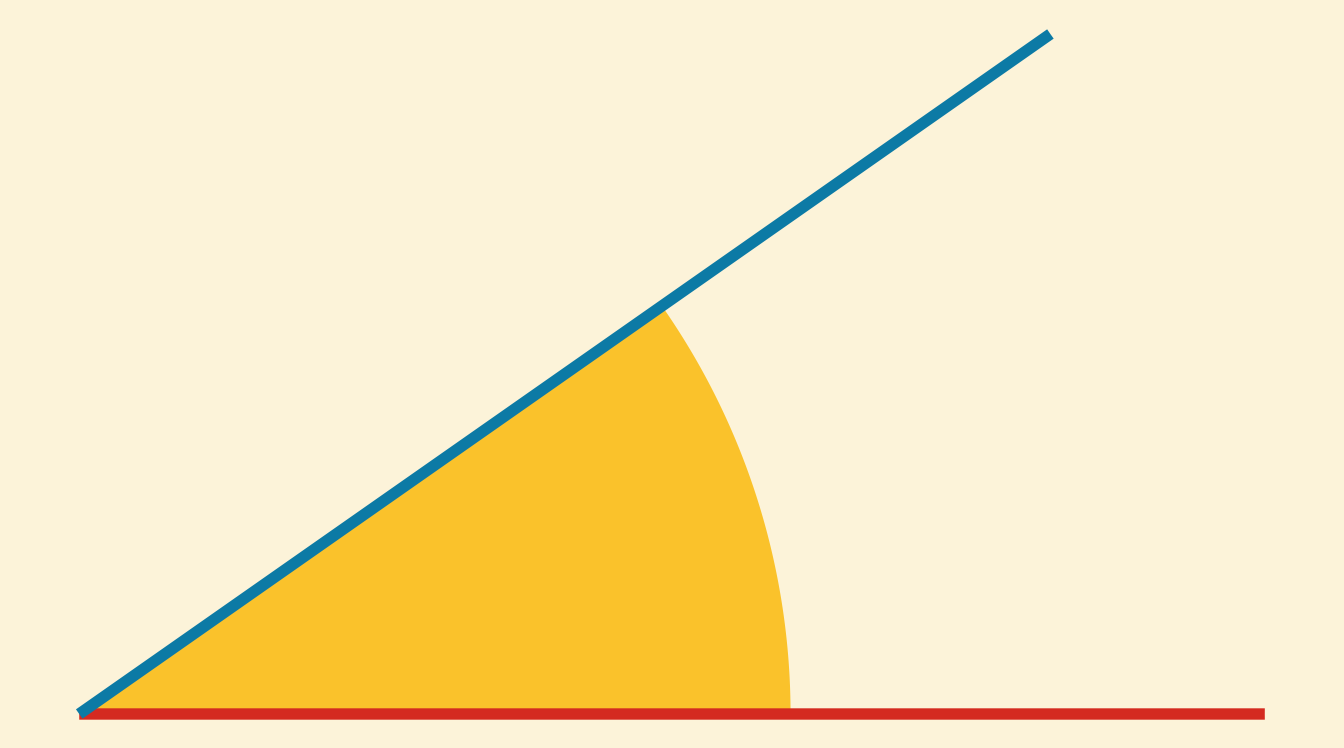
A plane rectilinear angle is the inclination of two straight lines to one another, which meet together, but are not in the same straight line.

Code
o <- ob_point(0, 0)
theta <- degree(c(0,35))
baseplot +
  ob_wedge(end = theta[2],
           radius = .6,
           fill = yellow) +
  ob_segment(o, ob_polar(theta, r = 1, color = c(red, blue))) 
Figure 1: Illustration of an angle

Definition X

When one straight line standing on another straight line makes the adjacent angles equal, each of these angles is called a right angle, and each of these lines is said to be perpendicular to the other.

Code
baseplot +
  ob_segment(o, ob_polar(degree(c(0,90, 180)))) + 
  {a <- ob_arc(o, radius = .85, start = c(0,90), end = c(90, 180), linewidth = 3)} +
  a@hatch(linewidth = 1) +
  ob_rectangle(o + ob_point(0,.05), height = .1, width = .2, linewidth = 1)
Figure 2: Illustration of right angles

Definition XV

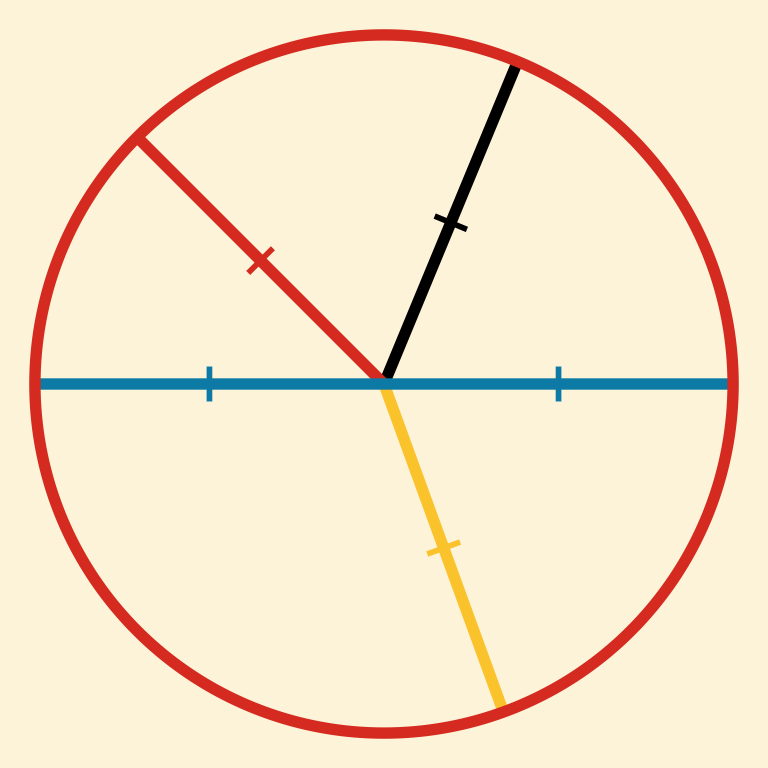
A circle is a plane figure, bounded by one continued line, called its circumference or periphery; and having a certain point within it, from which all straight lines drawn to its circumference are equal.

Code
baseplot +
  {s <- ob_segment(o, ob_polar(degree(c(135/2, 135, 290, 0, 180))),
             color = c(black, red, yellow, blue, blue))} + 
  s@hatch(linewidth = 1) +
  ob_circle(color = red)
Figure 3: A circle has a circumference line equally distant from a point.

Proposition 1

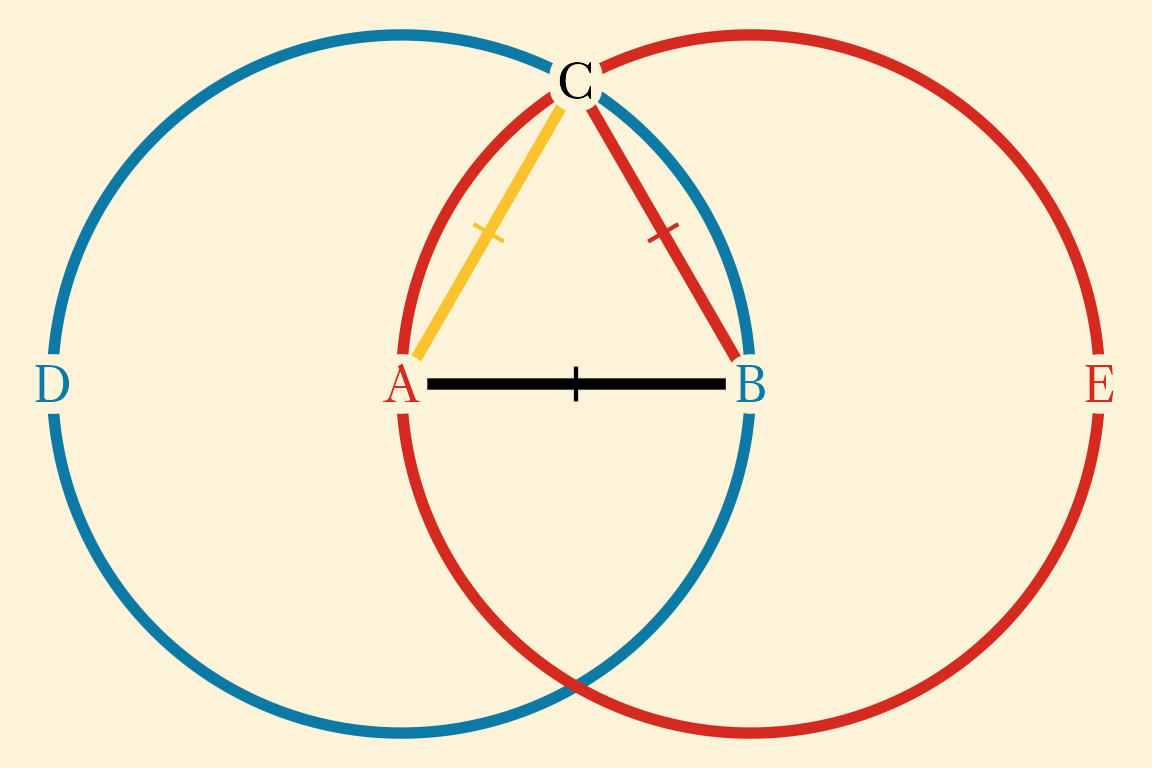
To construct an equilateral triangle on a given finite straight-line.

Let AB be the given finite straight-line.

So it is required to construct an equilateral triangle on the straight-line AB.

Let the circle BCD with center A and radius AB have been drawn, and again let the circle ACE with center B and radius BA have been drawn. And let the straight-lines CA and CB have been joined from the point C, where the circles cut one another, to the points A and B (respectively).

And since the point A is the center of the circle CDB, AC is equal to AB. Again, since the point B is the center of the circle CAE, BC is equal to BA. But CA was also shown (to be) equal to AB. Thus, CA and CB are each equal to AB. But things equal to the same thing are also equal to one another. Thus, CA is also equal to CB. Thus, the three (straight lines) CA, AB, and BC are equal to one another.

Thus, the triangle ABC is equilateral, and has been constructed on the given finite straight-line AB.

Code
# Radius
r <- 1

# Points A and B
pA <- ob_point(0, 0)
pB <- ob_polar(degree(0), r)

# Circles
cBCD <- ob_circle(pA, r, color = blue)
cACE <- ob_circle(pB, r, color = red)

# Intersection of circles to make equilateral triangle
pC <- intersection(cBCD, cACE)[1]

# Points to label circles
pD <- cBCD@point_at(180)
pE <- cACE@point_at(0)

# Segments AC and BC
sAB <- ob_segment(pA, pB, color = black)
sAC <- ob_segment(pA, pC, color = yellow)
sBC <- ob_segment(pB, pC, color = red)

# Bind segments
sABC <- bind(c(sAB, sAC, sBC))

# Hatch marks to note congruence
hABC <- sABC@hatch(linewidth = .75) 

# Make point labels
lABCDE <- ob_label(
  LETTERS[1:5],
  bind(c(pA, pB, pC, pD, pE)),
  fill = bg,
  color = c(red, blue, black, blue, red),
  size = 18,
  family = my_font,
  vjust = .5,
  label.padding = margin(4,3,0,3),
  label.r = unit(9, units = "pt")
)

baseplot +
  sABC +
  cBCD +
  cACE +
  lABCDE +
  hABC
Figure 4: Make an equilateral trigangle starting with line AB.

Proposition 2

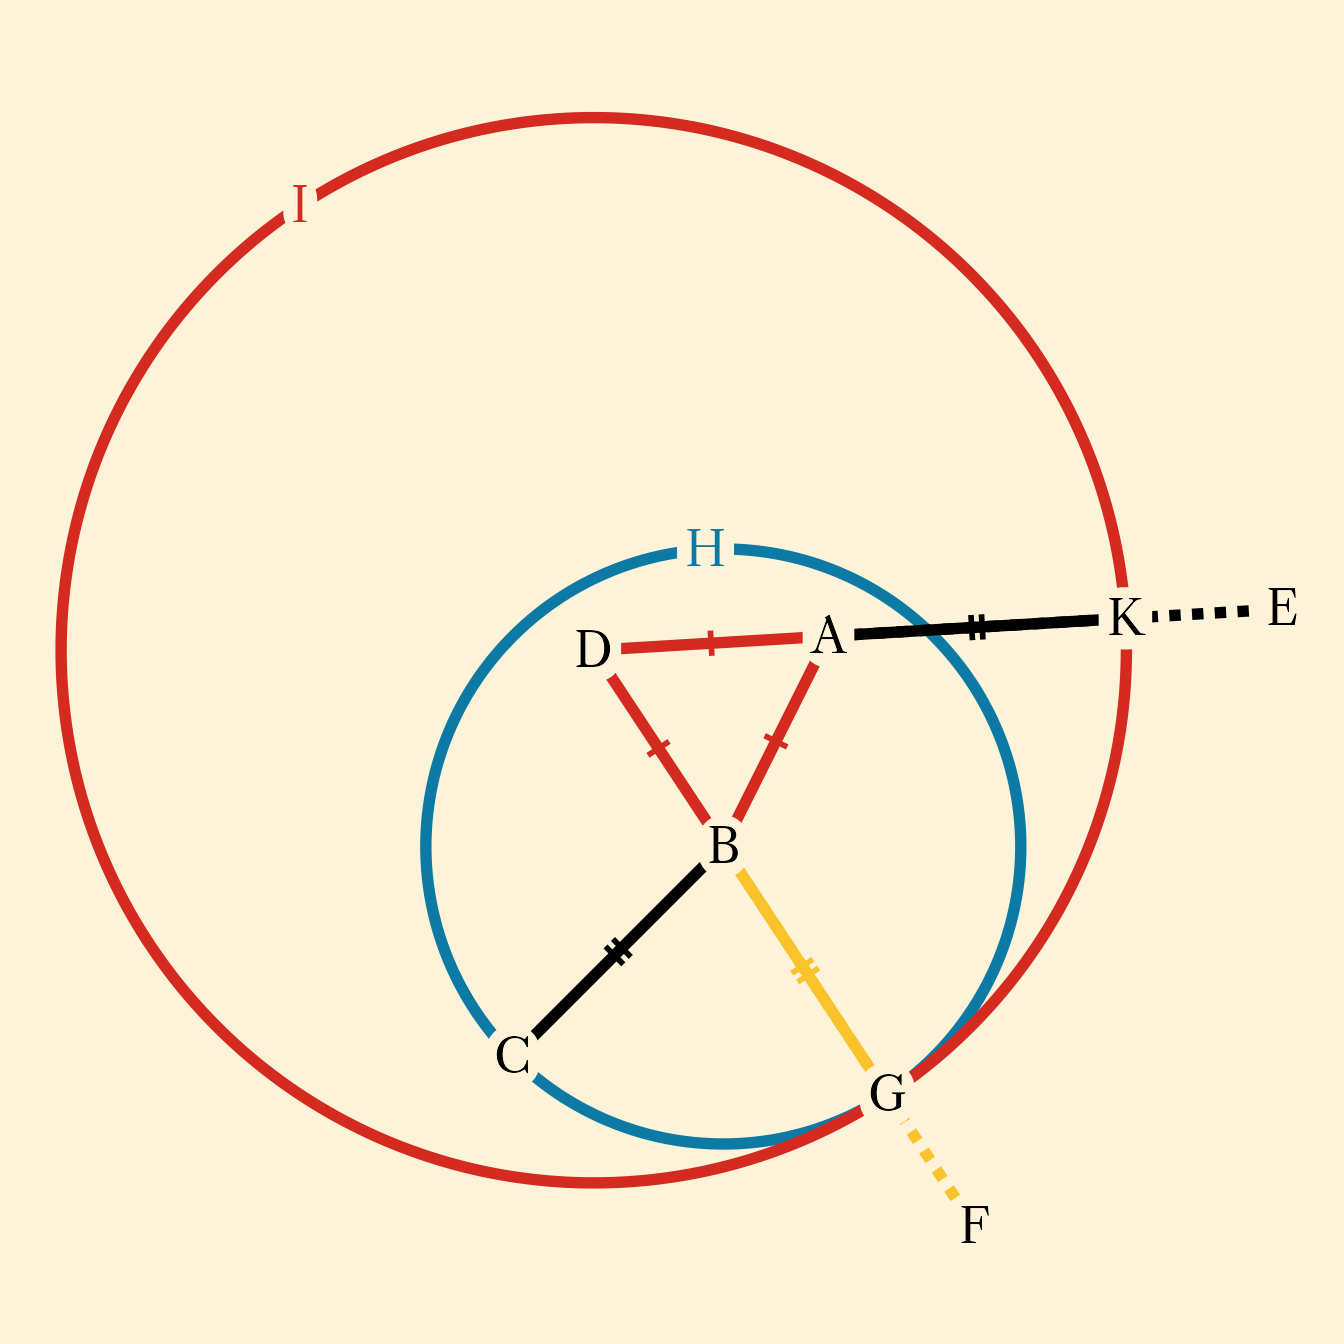
To place a straight line equal to a given straight line with one end at a given point.

Let A be the given point, and BC the given straight line.

It is required to place a straight line equal to the given straight line BC with one end at the point A.

Join the straight line AB from the point A to the point B, and construct the equilateral triangle DAB on it.

Produce the straight lines AE and BF in a straight line with DA and DB. Describe the circle CGH with center B and radius BC, and again, describe the circle GIJ with center D and radius DG.

Since the point B is the center of the circle CGH, therefore BC equals BG. Again, since the point D is the center of the circle GKI, therefore DL equals DG.

And in these DA equals DB, therefore the remainder AJ equals the remainder BG.

But BC was also proved equal to BG, therefore each of the straight lines AL and BC equals BG. And things which equal the same thing also equal one another, therefore AJ also equals BC.

Therefore the straight line AJ equal to the given straight line BC has been placed with one end at the given point A.

Code
pA <- ob_point(1, 2)
pB <- ob_point(0, 0)
pC <- ob_point(-2, -2)

sAB <- ob_segment(pA, pB, color = red)
sBC <- ob_segment(pB, pC)

r_AB <- distance(sAB)

pD <- intersection(ob_circle(pA, r_AB), ob_circle(pB, r_AB))[2]

sAD <- ob_segment(pA, pD, color = red)
sBD <- ob_segment(pB, pD, color = red)

p_ABD <- bind(c(pA, pB, pD))

cCGH <- ob_circle(pB, distance(pB, pC), color = blue)
pH <- cCGH@point_at(sAD@line@angle + degree(90))

pF <- cCGH@normal_at(sBD@line@angle, 1.5)

sBF <- ob_segment(pB, pF, color = yellow, linetype = "11")
sDF <- ob_segment(pD, pF)

pG <- intersection(sDF, cCGH)

sBG <- ob_segment(pB, pG, color = yellow)

cGIK <- ob_circle(pD, distance(pD, pG), color = red)

pI <- cGIK@point_at(sBD@line@angle + degree(180))
pE <- cGIK@normal_at((pA - pD)@theta, 1.5)

sAE <- ob_segment(pA, pE, color = black, linetype = "11")

pK <- intersection(sAE, cGIK)

sAK <- ob_segment(pA, pK, color = black)

p <- bind(c(pA, pB, pC, pD, pE, pF, pG, pH, pI, pK))

pABD <- ob_path(bind(c(pA,pD,pB, pA)), color = red, linewidth = 2)

baseplot +
  sBC +
  pABD +
  bind(c(sAB, sBD, sAD))@hatch(
    linewidth = 1, 
    height = .12) +
  bind(c(sBC, sAK, sBG))@hatch(
    k = 2,
    height = .12,
    linewidth = 1,
    sep = .1
  ) +
  cCGH +
  sBF +
  sBG +
  sAE +
  sAK +
  cGIK +
  p@label(c(LETTERS[1:9], "K"), 
          fill = bg, 
          # vjust = c(rep(.55, 9), .5),
          label.r = unit(9, units = "pt"),
          label.padding = margin(4,3,1,3))
Figure 5: Make a line starting at point A the same length as line BC

Proposition 47

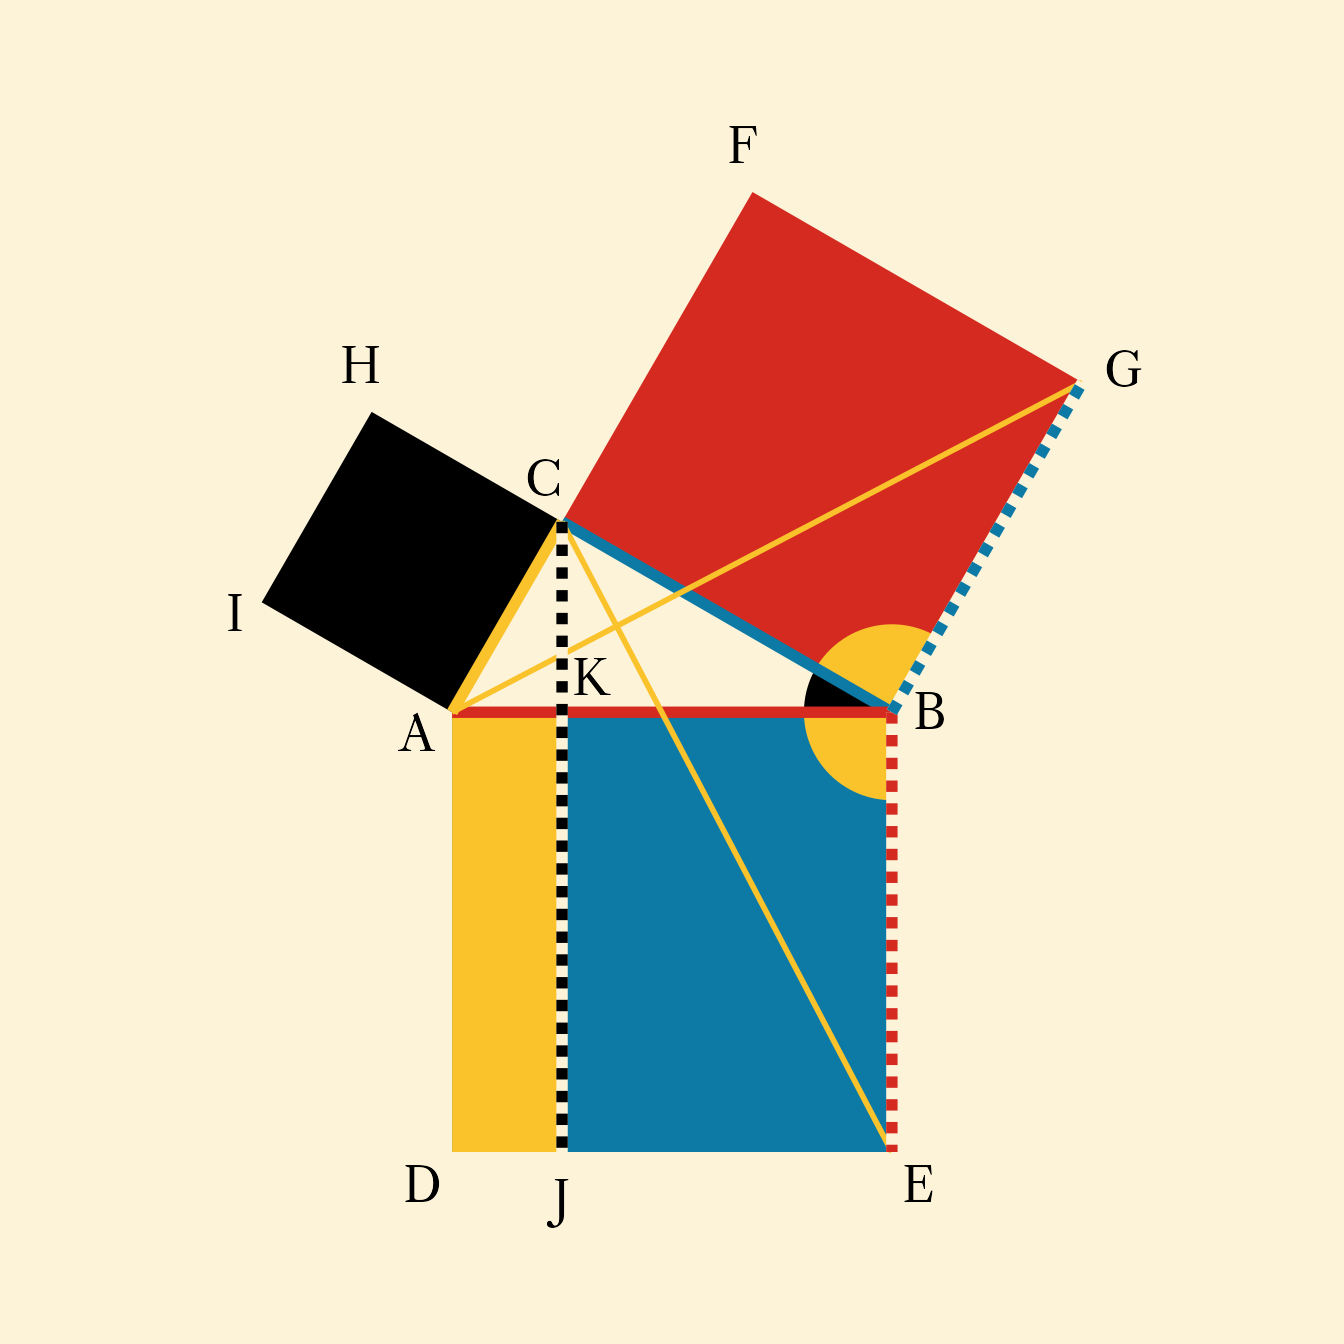
Let ABC be a right-angled triangle having the angle ACB right.

I say that the square on AB equals the sum of the squares on AC and BC.

Describe the square ADEB on AB, and the squares HA and FB on AC and CB. Draw AJ through A parallel to either AD or BE. K is the intersection of AB and CJ.

Join CE and AG.

Angle CBG = Angle ABE. To each add angle CBA. Therefore, angle ABG = angle CBE, and because BE = AB and CB = BG, triangle ABG = triangle CBE.

Because AC is parallel to BG, and triangle ABG and rectangle BCFG share side BG, twice the area of triangle ABG is equal to the area of rectangle BCFG.

Because CJ is parallel to BE, and triangle CBE. and rectangle KJEB share side BE, twice the area of triangle CBE is equal to the area of rectangle KJEB.

Because triangle ABG = triangle CBE, twice the area of triangle ABG = twice the area of triangle CBE = area of rectangle BCFG = area of rectangle BCFG.

In the same manner it may be shown that the area of rectangle ACHI and rectangle ADJK are equal.

The sum of the area of rectangle ADJK and the area of rectangle KJEB equals the area of rectangle ADEB. Therefore, the sum of the area of rectangle ACHI and the area of rectangle BCFG equals the area of rectangle ADEB.

Code
pA <- ob_point(0,0)
pB <- ob_point(2,0)

sAB <- ob_segment(pA,pB, color = red)

pC <- ob_circle(sAB@midpoint(), 
                radius = distance(pA, pB) / 2)@point_at(120)

sAC <- ob_segment(pA, pC, color = yellow)
sBC <- ob_segment(pB, pC, color = blue)

pD <- rotate(pB, degree(-90), origin = pA)
pE <- rotate(pA, degree(90), origin = pB)

pF <- rotate(pB, degree(90), origin = pC)
pG <- rotate(pC, degree(-90), origin = pB)

pH <- rotate(pA, degree(-90), origin = pC)
pI <- rotate(pC, degree(90), origin = pA)


# make copy so underlying dash is background color
sBE <- ob_segment(pB,
                  pE,
                  color = red,
                  linetype = "11")

sBE2 <- sBE %>% set_props(color = bg, linetype = "solid")

sCE <- ob_segment(pC, pE, color = yellow, linewidth = 1)
sAG <- ob_segment(pA, pG, color = yellow, linewidth = 1)
sCD <- ob_segment(pC, pD, color = blue, linewidth = 1)
sBI <- ob_segment(pB, pI, color = blue, linewidth = 1)


sBG <- ob_segment(pB,
                  pG,
                  color = blue,
                  linetype = "11")

sBG2 <- sBG %>% 
  set_props(color = bg, 
            linetype = "solid")

lC <- ob_line(xintercept = pC@x)
sDE <- ob_segment(pD, pE)
pJ <- intersection(lC, sDE)
pK <- intersection(lC, sAB)

sCJ <- ob_segment(pC,
                  pJ,
                  color = black,
                  linetype = "11")

sCJ2 <- sCJ %>% 
  set_props(color = bg, 
            linetype = "solid")

# Bind points
p <- bind(c(pA, pB, pC, pD, pE, pF, pG, pH, pI, pJ, pK))
# points for orienting labels
p_orient <- bind(
  c(pG, pA, pE, pB, pA, pB, pC, pA, pC, pC, nudge(pK, -.01, -.01))
)
# polar adjustments for labels
p_just <- ob_polar((p - p_orient)@theta , r = 1.4)


baseplot +
  scale_y_continuous(expand = expansion(.2)) +
  ob_polygon(bind(c(pB, pC, pF, pG)), fill = red, color = NA) +
  ob_polygon(bind(c(pA, pB, pE, pD)), fill = blue, color = NA) +
  ob_polygon(bind(c(pA, pC, pH, pI)), fill = black, color = NA) +
  ob_polygon(bind(c(pA, pD, pJ, pK)), fill = yellow, color = NA) +
  ob_wedge(
    pB,
    radius = .4,
    start = (pC - pB)@theta,
    end = (pA - pB)@theta,
    fill = black,
    color = NA
  ) +
  ob_wedge(
    pB,
    radius = .4,
    start = (pA - pB)@theta,
    end = (pE - pB)@theta@positive,
    fill = yellow,
    color = NA
  ) +
  ob_wedge(
    pB,
    radius = .4,
    start = (pG - pB)@theta,
    end = (pC - pB)@theta,
    fill = yellow,
    color = NA
  ) +
  sBC +
  sAB +
  sCE +
  sAG +
  sAC +
  sCJ2 + sCJ +
  sBE2 + sBE +
  sBG2 + sBG +
  ob_label(
    c(LETTERS[seq(1, p@length)]),
    center = p,
    fill = NA,
    color = black,
    polar_just = p_just,
    label.r = unit(9, units = "pt"),
    label.padding = margin(4, 3, 1, 3)
  )
Figure 6: Proof of the Pythagorean Theorem

Book IV

Definition III

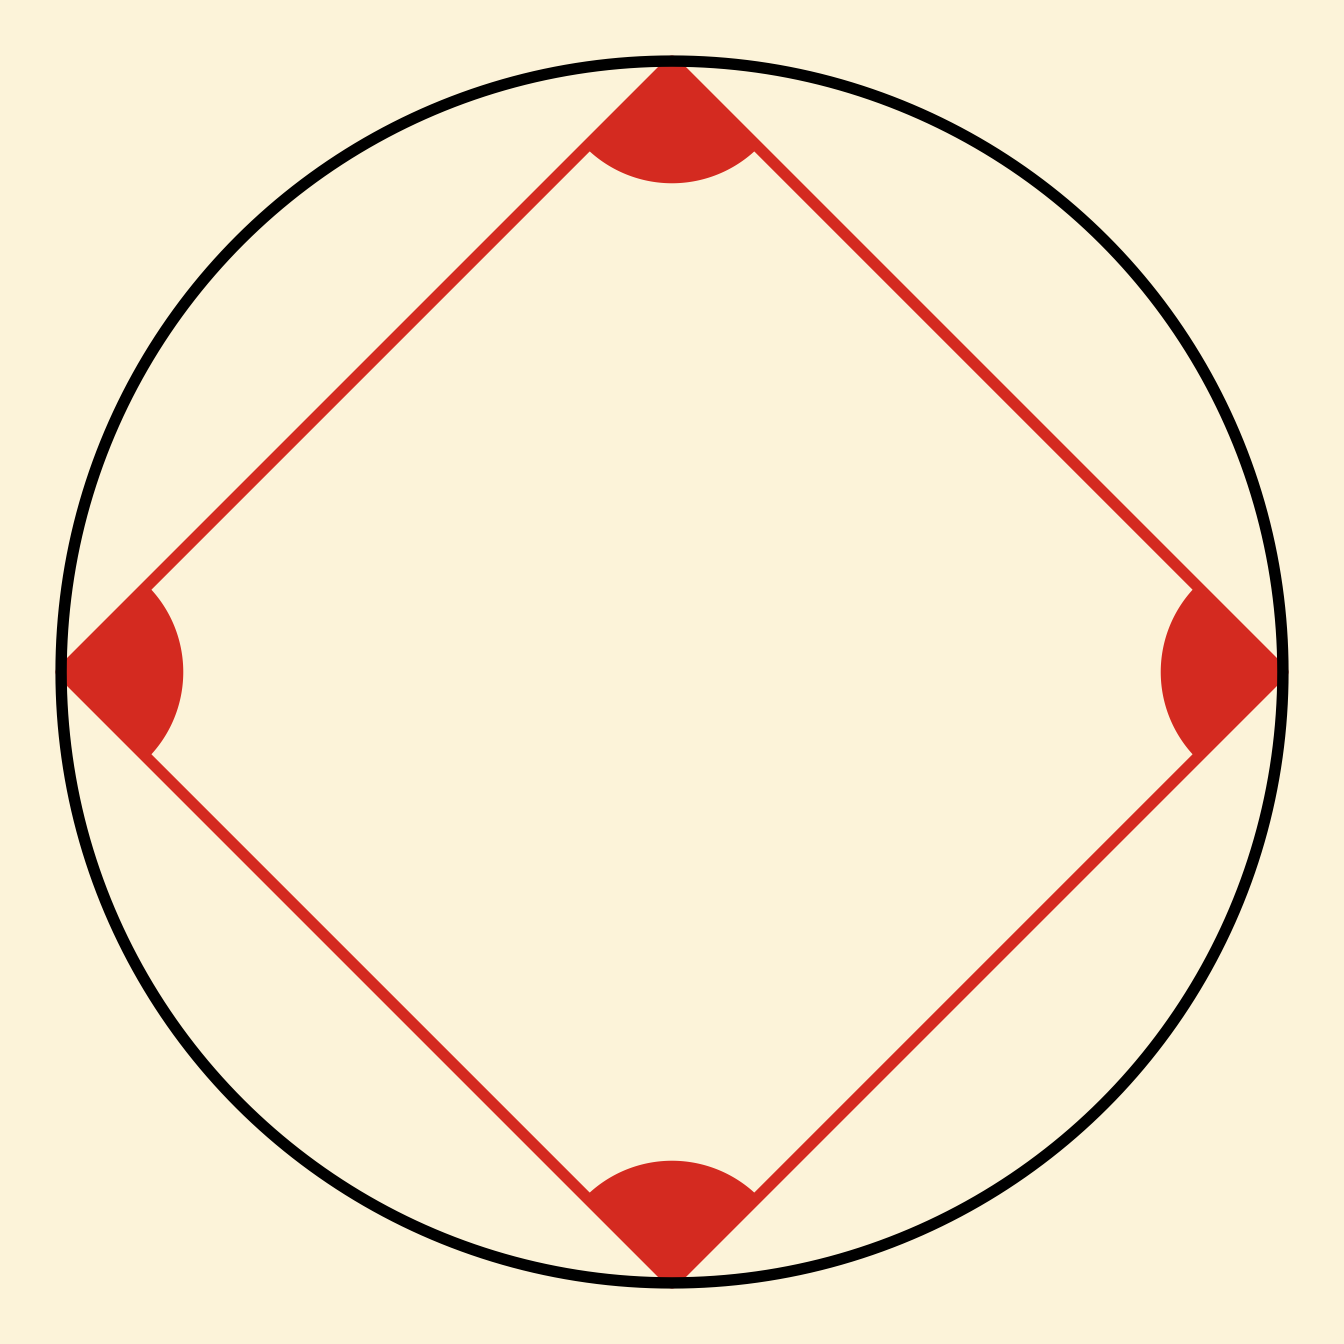
A rectilinear figure is said to be inscribed in a circle, when the vertex of each angle of the figure is in the circumference of the circle.

Code
p0 <- ob_point(0,0)
c0 <- ob_circle(p0)
pABCD <- c0@point_at(degree(seq(0, 270, 90)))

baseplot + 
  ob_polygon(pABCD, color = red, fill = NA) +
  ob_wedge(pABCD, start = pABCD@theta + degree(135), end = pABCD@theta + degree(225), radius = .2, fill = red) +
  c0 
Figure 7

Definition IV

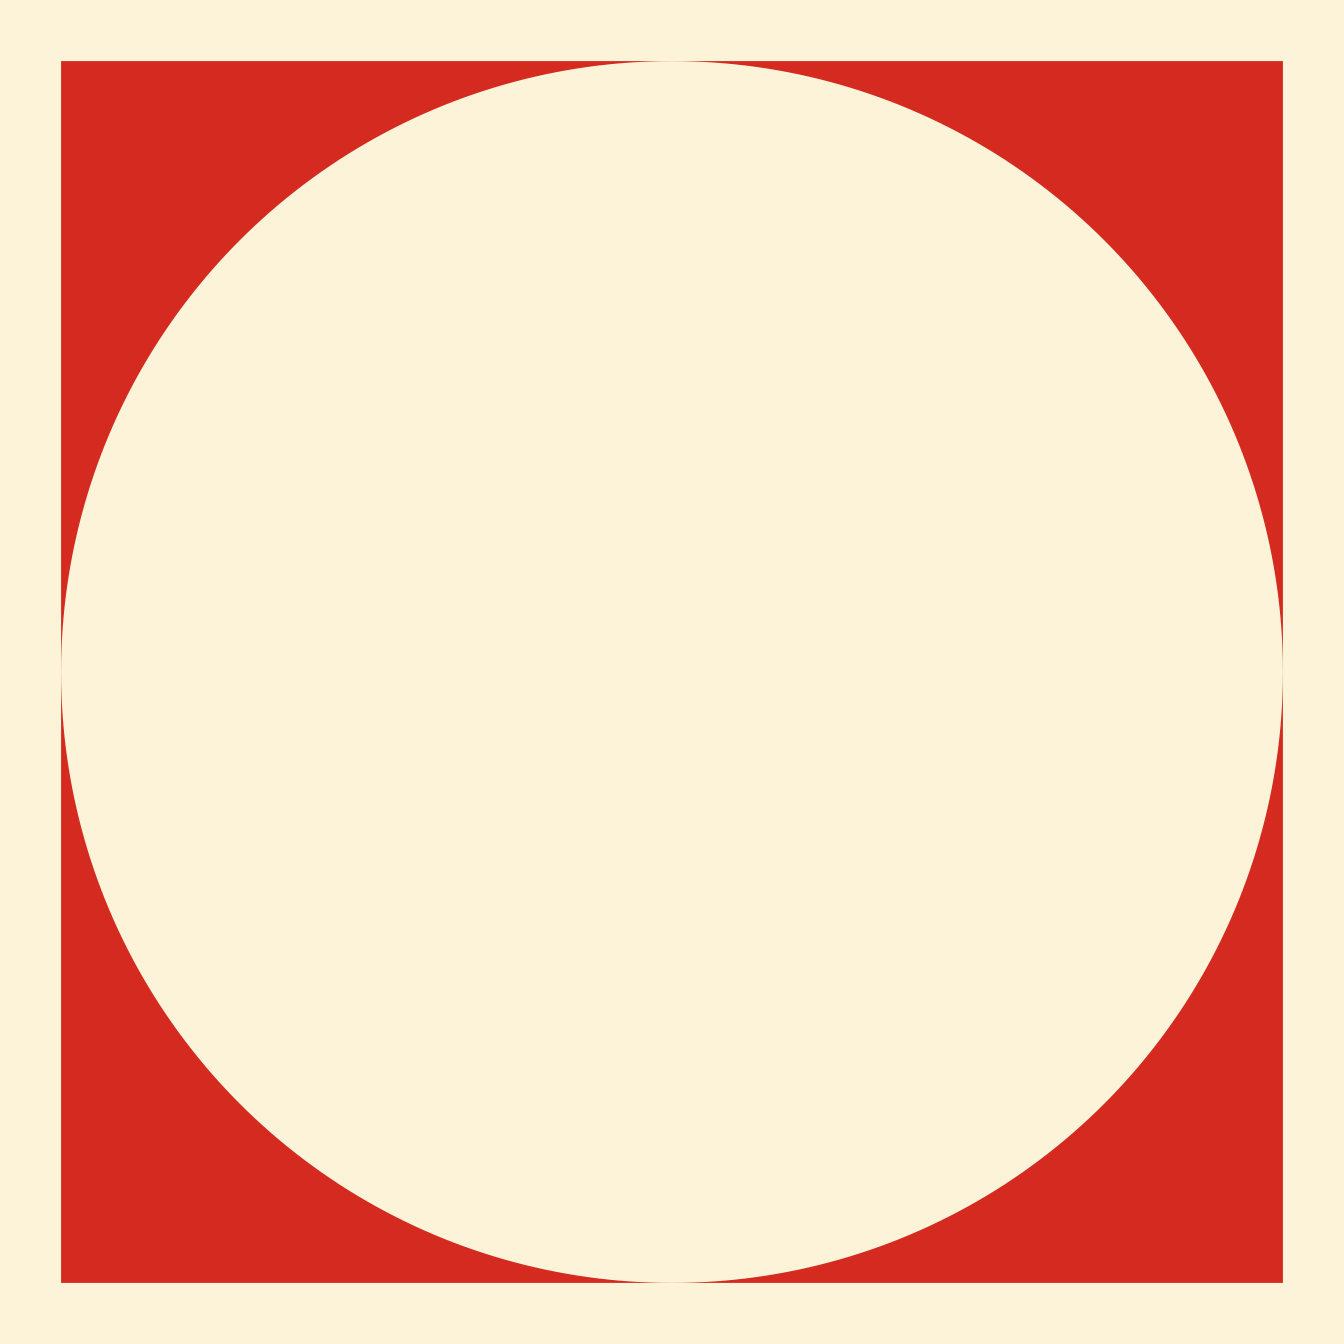
A rectilinear figure is said to be circumscribed about a circle, when each of its sides is a tangent to the circle.

Code
baseplot + 
  {ng <- ob_ngon(n = 4, fill = red, angle = 45)} +
  ob_circle(fill = bg, color = NA, radius = ng@apothem)
Figure 8

Definition V

A circle is said to be inscribed in a rectilinear figure, when each side of the figure is a tangent to the circle.

Code
baseplot +
  {ng <- ob_ngon(n = 6, fill = blue)} +
  ob_circle(fill = bg, color = NA, radius = ng@apothem)
Figure 9

Definition VI

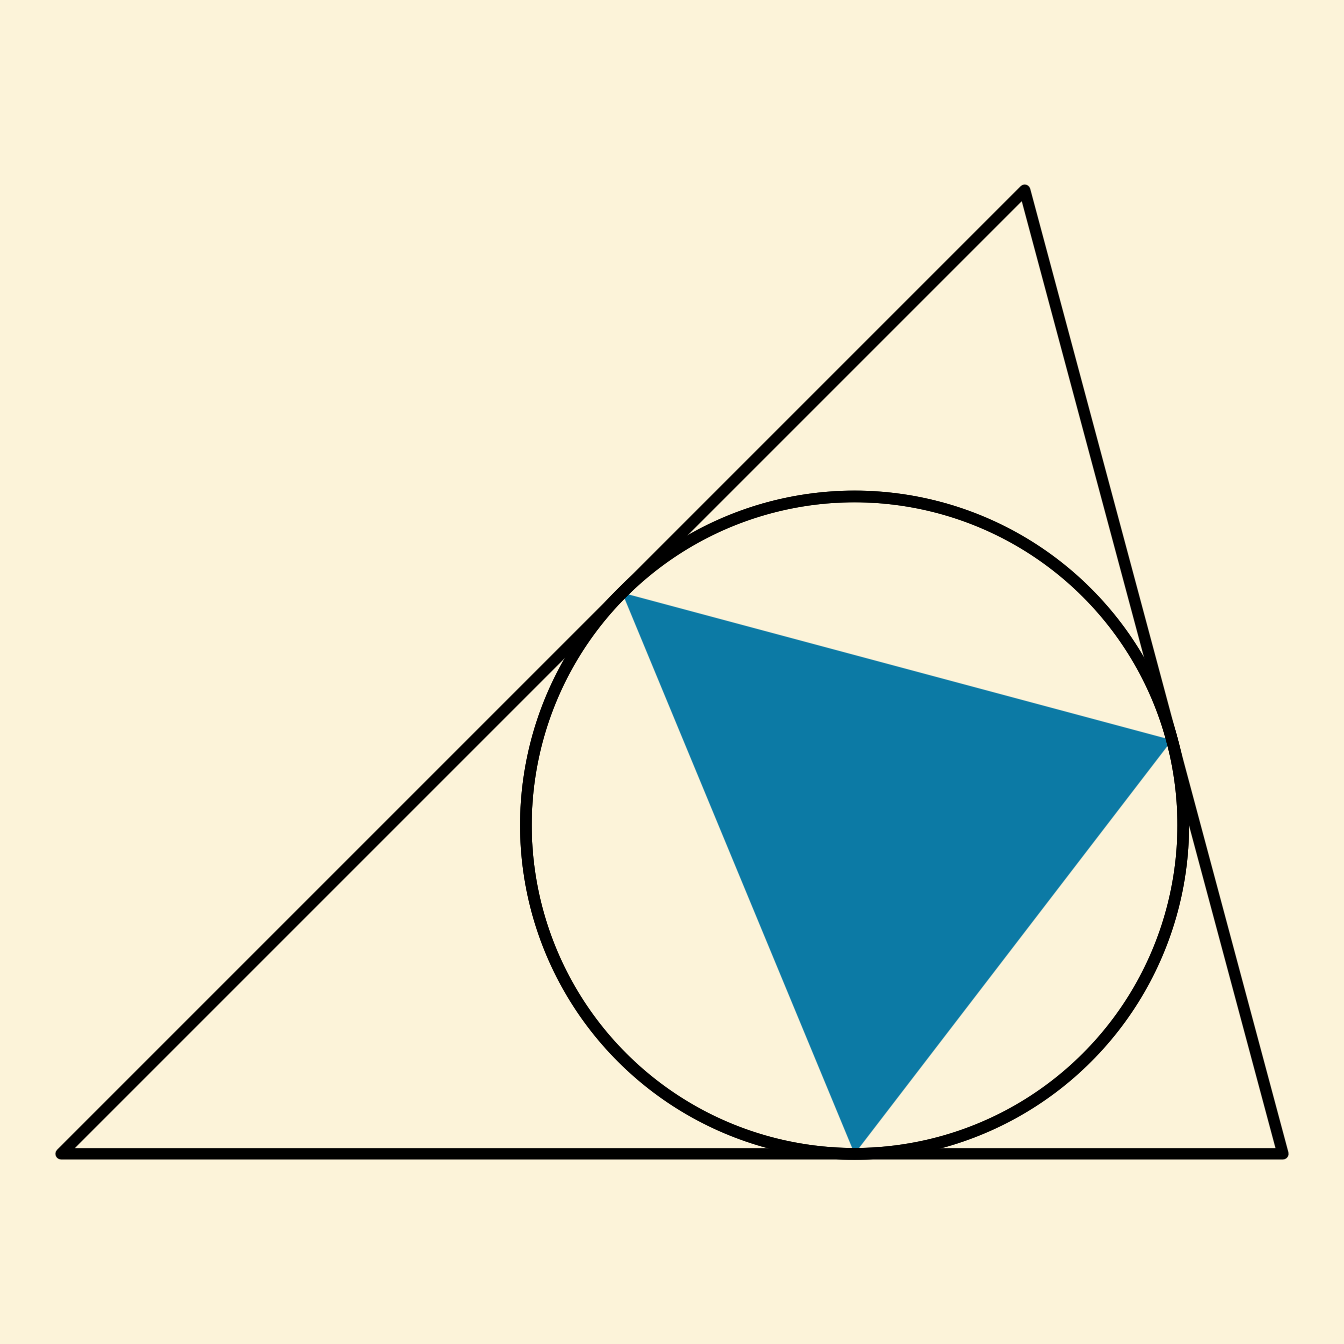
A circle is said to be circumscribed about a rectilinear figure, when the circumference passes through the vertex of each angle of the figure.

Code
# Points for inner triangle
p <- ob_polar(degree(c(270, 15, 135)))
# Circle from 3 points
c1 <- circle_from_3_points(p)
tangents <- c1@angle_at(p) %>% 
  c1@tangent_at()

circumscribed <- intersection(
  tangents[c(1,1,2)], 
  tangents[c(2,3,3)]) %>% 
  ob_polygon(color = black, fill = NA)

baseplot + 
  ob_polygon(p, fill = blue, color = NA) + 
  c1 +
  circumscribed 
  
  
Figure 10
Code

d <- 1.4
node <- redefault(
  ob_circle,
  radius = 1 / sqrt(pi),
  fill = blue,
  alpha = .5,
  color = blue,
  linewidth = 1
)
ct <- redefault(
  connect,
  resect = 1,
  color = black,
  alpha = .3,
  linewidth = .75,
  length_head = 5
)

transition <- redefault(
  ob_rectangle,
  height = 1,
  width = 1,
  color = black,
  fill = black,
  alpha = .3,
  linewidth = .75
)
ggdiagram(font_family = "Roboto Condensed", font_size = 20) +
  {waiting <- node()} +
  {critical <- node() %>% place(waiting, "below", d)} +
  {s <- node() %>% place(critical, "below", d)
   s1 <- node(fill = red, color = red) %>% place(s, "left", 0)
   }  +
  {s2 <- node(fill = red, color = red) %>% place(s, "right", 0)} +
  {leave <- transition() %>% place(critical, "right", d)} + 
  {enter <- transition() %>% place(critical, "left", d)} + 
  {s3 <- node() %>% place(s, "below", d)} + 
  {e2 <- transition() %>% place(s3, "left", d)} +
  {l2 <- transition() %>% place(s3, "right", d)} +
  {s4 <- node() %>% place(s3, "below", d)} +
  bind(c(waiting@center, 
         s4@center, 
         s2@center + ob_polar(degree(c(90, 210, 330)), .2))) %>% set_props(color = black, fill = NA_character_, size = 4, alpha = 1) +
  bind(c(
    ct(enter, bind(c(critical, s1))),
    ct(critical, leave),
    ct(s1, bind(c(leave, l2))),
    ct(leave, s2),
    ct(s2, bind(c(enter, e2))),
    ct(e2, bind(c(s1, s3))),
    ct(l2, s2),
    ct(s3, l2)
  )) +
  ob_bezier(c(bind(c(waiting@point_at("west"),
                   waiting@center %-|% enter@center,
                   enter@point_at("north"))),
              bind(c(s4@point_at("west"),
                   s4@center %-|% e2@center,
                   e2@point_at("south"))),
              bind(c(l2@point_at("south"),
                   l2@center %|-% s4@center,
                   s4@point_at("east"))),
              bind(c(leave@point_at("north"),
                   leave@center %|-% waiting@center,
                   waiting@point_at("east")))), 
            resect = 2, 
            arrow_head = arrowheadr::arrow_head_deltoid(2.3), 
            linewidth = .75, 
            color = black,
            alpha = .5,length_head = 5) +
  ob_latex(
    "s",
    ob_point() %>% place(s1, "left", .15),
    color = red,
    hjust = 1,
    fill = NA,
    width = .4,
    density = 600
  ) +
  ob_latex(
    "\\bar{s}",
    ob_point() %>% place(s2, "right", .15),
    color = red,
    fill = NA,
    hjust = 0,
    width = .4,
    density = 600
  )